


SurfaceContourPlot3D
SurfaceContourPlot3D[f,p∈reg]
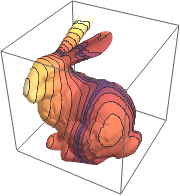
generates a contour plot of f over the surface reg as a function of p.
Details and Options
- SurfaceContourPlot3D is also known as chloropleth map and thematic map.
- SurfaceContourPlot3D uses color to associate numeric values with points on a region.
- SurfaceContourPlot3D[f,p∈reg] makes a contour plot of the geometric region reg with contour curves corresponding to the level sets of the function f.
- SurfaceContourPlot3D has the same options as Graphics3D and Graphics, with the following additions and changes:
-
Axes True whether to draw axes BoundaryStyle Automatic how to style surface boundaries BoxRatios Automatic bounding 3D box ratios ColorFunction Automatic how to color the plot ColorFunctionScaling True whether to scale the arguments to ColorFunction Contours Automatic how many or what contours to show ContourShading Automatic how to shade regions between contours ContourStyle Automatic the style for contour lines PerformanceGoal $PerformanceGoal aspects of performance to optimize PlotLegends None legends for color gradients PlotRange Automatic range of f or other values to include PlotTheme $PlotTheme overall theme for the plot WorkingPrecision MachinePrecision the precision used in internal computations - ColorFunction is by default supplied with the scaled value of f.
Examples
open all close allBasic Examples (2)
Scope (7)
Specification (2)
SurfaceContourPlot3D works on 3D regions:
SurfaceContourPlot3D[x + y, {x, y, z} ∈ Ellipsoid[{0, 0, 0}, {4, 3, 2}]]RegionValuePlot works with MeshRegion:
ℛ = MeshRegion[{{0, 0, 0}, {2, 0, 0}, {2, 2, 0}, {0, 2, 0}, {1, 1, 2}}, {Tetrahedron[{1, 2, 3, 5}], Tetrahedron[{1, 3, 4, 5}]}];SurfaceContourPlot3D[x, {x, y, z} ∈ ℛ]ℛ = BoundaryMeshRegion[{{0, 0, 0}, {1, 0, 0}, {0, 1, 0}, {0, 0, 1}}, Polygon[{{1, 2, 3}, {1, 2, 4}, {2, 3, 4}, {1, 3, 4}}]];SurfaceContourPlot3D[y, {x, y, z} ∈ ℛ]Presentation (5)
Use PlotTheme to immediately get overall styling:
Table[SurfaceContourPlot3D[y, {x, y, z} ∈ Torus[], PlotLabel -> t, PlotTheme -> t], {t, {"Minimal", "Monochrome", "Marketing"}}]Use PlotLegends to get a color bar for the different values:
SurfaceContourPlot3D[z, {x, y, z} ∈ Cone[], PlotLegends -> Automatic]Control the display of axes with Axes:
Table[SurfaceContourPlot3D[x ^ 2 + y ^ 2 + z ^ 2, {x, y, z} ∈ Cone[], PlotLabel -> a, Axes -> a], {a, {True, False, {True, False, True}}}]Label axes using AxesLabel and the whole plot using PlotLabel:
SurfaceContourPlot3D[x + z, {x, y, z} ∈ Cylinder[], AxesLabel -> {x, y, z}, PlotLabel -> x + z]Color the plot by the function values with ColorFunction:
Table[SurfaceContourPlot3D[x y z, {x, y, z} ∈ Sphere[], PlotLabel -> c, ColorFunction -> c], {c, {Hue, "BlueGreenYellow"}}]Options (55)
Axes (3)
SurfaceContourPlot3D[Norm[p], p ∈ Cylinder[]]Use AxesFalse to remove the axes:
SurfaceContourPlot3D[Norm[p], p ∈ Cylinder[], Axes -> False]Turn each axis on individually:
{SurfaceContourPlot3D[Norm[p], p ∈ Cylinder[], Axes -> {True, False, False}], SurfaceContourPlot3D[Norm[p], p ∈ Cylinder[], Axes -> {False, True, False}], SurfaceContourPlot3D[Norm[p], p ∈ Cylinder[], Axes -> {False, False, True}]}AxesLabel (4)
No axes labels are drawn by default:
SurfaceContourPlot3D[First[p], p ∈ Cone[]]SurfaceContourPlot3D[First[p], p ∈ Cone[], AxesLabel -> "height"]Use specific labels for each axis:
SurfaceContourPlot3D[First[p], p ∈ Cone[], AxesLabel -> {"width", "depth", "height"}]Use labels based on variables specified in SurfaceContourPlot3D:
SurfaceContourPlot3D[x y, {x, y, z} ∈ Cone[], AxesLabel -> Automatic]AxesOrigin (2)
AxesStyle (3)
Change the style for the axes:
SurfaceContourPlot3D[x, {x, y, z} ∈ Sphere[], AxesStyle -> Red]Specify the style of each axis:
SurfaceContourPlot3D[x, {x, y, z} ∈ Sphere[], AxesStyle -> {{Thick, Brown}, {Thick, Blue}, {Thick, Green}}]Use different styles for the ticks and the axes:
SurfaceContourPlot3D[x, {x, y, z} ∈ Sphere[], AxesStyle -> Green, TicksStyle -> Red]BoxRatios (2)
By default, the bounding box displays the 3D coordinate values at their natural scale:
SurfaceContourPlot3D[x, {x, y, z} ∈ Torus[]]Use custom length ratios for each side of the bounding box:
SurfaceContourPlot3D[x, {x, y, z} ∈ Torus[], BoxRatios -> {1, 2, 2}]ColorFunction (3)
Color the slice surfaces according to the density values ![]() :
:
SurfaceContourPlot3D[x, {x, y, z} ∈ Torus[], ColorFunction -> Hue]Use a named color gradient available in ColorData:
SurfaceContourPlot3D[x, {x, y, z} ∈ Torus[], ColorFunction -> "IslandColors"]SurfaceContourPlot3D[x, {x, y, z} ∈ Torus[], ColorFunction -> (If[# < 0, Red, Green]&), ColorFunctionScaling -> False]ColorFunctionScaling (2)
By default, scaled values are used:
SurfaceContourPlot3D[x y z, {x, y, z} ∈ Torus[], ColorFunction -> Hue]Use ColorFunctionScalingFalse to get access to unscaled f values:
SurfaceContourPlot3D[x y z, {x, y, z} ∈ Torus[], ColorFunction -> Hue, ColorFunctionScaling -> False]Contours (4)
Use 5 equally spaced contours:
SurfaceContourPlot3D[x ^ 3 + y ^ 2 - z ^ 2, {x, y, z} ∈ Cube[2], Contours -> 5]Use automatic contour selection:
SurfaceContourPlot3D[x ^ 3 + y ^ 2 - z ^ 2, {x, y, z} ∈ Cube[2], Contours -> Automatic]Specify an explicit set of contours:
SurfaceContourPlot3D[x ^ 3 + y ^ 2 - z ^ 2, {x, y, z} ∈ Cube[2], Contours -> {-1, 1}]Use specific contours with specific styles:
SurfaceContourPlot3D[x ^ 3 + y ^ 2 - z ^ 2, {x, y, z} ∈ Cube[2], Contours -> {{-1, Green}, {1, Dashed}}]ContourStyle (1)
ContourShading (4)
ContourShadingAutomatic computes contour region shading from the ColorFunction:
SurfaceContourPlot3D[Exp[-(x ^ 2 + y ^ 2 + z ^ 2)], {x, y, z} ∈ Cube[], Contours -> 9, BoundaryStyle -> None, ContourShading -> Automatic, ColorFunction -> "BrightBands"]Cyclically repeat shading styles:
SurfaceContourPlot3D[Exp[-(x ^ 2 + y ^ 2 + z ^ 2)], {x, y, z} ∈ Cube[], Contours -> 9, BoundaryStyle -> None, ContourShading -> {Orange, Blue}]Leave every third contour region empty, starting from the second:
SurfaceContourPlot3D[Exp[-(x ^ 2 + y ^ 2 + z ^ 2)], {x, y, z} ∈ Cube[], Contours -> 9, BoundaryStyle -> None, ContourShading -> {Orange, None, Blue}]Leave the regions between contours blank:
SurfaceContourPlot3D[Exp[-(x ^ 2 + y ^ 2 + z ^ 2)], {x, y, z} ∈ Cube[], Contours -> 9, BoundaryStyle -> None, ContourShading -> None]ImageSize (7)
Use named sizes such as Tiny, Small, Medium and Large:
{SurfaceContourPlot3D[x y z, {x, y, z} ∈ Sphere[], ImageSize -> Tiny], SurfaceContourPlot3D[x y z, {x, y, z} ∈ Sphere[], ImageSize -> Small]}Specify the width of the plot:
{SurfaceContourPlot3D[x y z, {x, y, z} ∈ Sphere[], ImageSize -> 150], SurfaceContourPlot3D[x y z, {x, y, z} ∈ Sphere[], AspectRatio -> 1.5, ImageSize -> 150]}Specify the height of the plot:
{SurfaceContourPlot3D[x y z, {x, y, z} ∈ Sphere[], ImageSize -> {Automatic, 150}], SurfaceContourPlot3D[x y z, {x, y, z} ∈ Sphere[], AspectRatio -> 2, ImageSize -> {Automatic, 150}]}Allow the width and height to be up to a certain size:
{SurfaceContourPlot3D[x y z, {x, y, z} ∈ Sphere[], ImageSize -> UpTo[200]], SurfaceContourPlot3D[x y z, {x, y, z} ∈ Sphere[], AspectRatio -> 2, ImageSize -> UpTo[200]]}Specify the width and height for a graphic, padding with space if necessary:
SurfaceContourPlot3D[x y z, {x, y, z} ∈ Sphere[], ImageSize -> {200, 300}, Background -> StandardGray]Setting AspectRatioFull will fill the available space:
SurfaceContourPlot3D[x y z, {x, y, z} ∈ Sphere[], AspectRatio -> Full, ImageSize -> {200, 300}, Background -> StandardGray]Use maximum sizes for the width and height:
{SurfaceContourPlot3D[x y z, {x, y, z} ∈ Sphere[], ImageSize -> {UpTo[150], UpTo[150]}], SurfaceContourPlot3D[x y z, {x, y, z} ∈ Sphere[], AspectRatio -> 2, ImageSize -> {UpTo[150], UpTo[150]}]}Use ImageSizeFull to fill the available space in an object:
Framed[Pane[SurfaceContourPlot3D[x y z, {x, y, z} ∈ Sphere[], ImageSize -> Full, Background -> StandardGray], {200, 100}]]Specify the image size as a fraction of the available space:
Framed[Pane[SurfaceContourPlot3D[x y z, {x, y, z} ∈ Sphere[], AspectRatio -> Full, ImageSize -> {Scaled[0.5], Scaled[0.5]}, Background -> StandardGray], {200, 200}]]PlotLegends (3)
Show a legend for the densities:
SurfaceContourPlot3D[x y z, {x, y, z} ∈ Sphere[], PlotLegends -> Automatic]PlotLegends automatically matches the color function:
SurfaceContourPlot3D[x y z, {x, y, z} ∈ Sphere[], ColorFunction -> "IslandColors", PlotLegends -> Automatic]Control placement of the legend with Placed:
SurfaceContourPlot3D[x y z, {x, y, z} ∈ Sphere[], PlotLegends -> Placed[Automatic, Above]]PlotRange (3)
Show All contours by default:
SurfaceContourPlot3D[x y z, {x, y, z} ∈ Sphere[]]SurfaceContourPlot3D[x y z, {x, y, z} ∈ Sphere[], PlotRange -> {All, All, {0, 2}}]Show only function values between 0 and 2:
SurfaceContourPlot3D[x + y + z, {x, y, z} ∈ Sphere[], PlotRange -> {0, 2}]Or with the fully qualified specification:
SurfaceContourPlot3D[x + y + z, {x, y, z} ∈ Sphere[], PlotRange -> {All, All, All, {0, 2}}]PlotTheme (3)
Use a theme with detailed grid lines, ticks, and legends:
SurfaceContourPlot3D[x y z, {x, y, z} ∈ Sphere[], PlotTheme -> "Detailed"]Any option setting overrides PlotTheme settings, in this case removing face grids:
SurfaceContourPlot3D[x y z, {x, y, z} ∈ Sphere[], PlotTheme -> "Detailed", FaceGrids -> None]Compare different plot themes:
Table[SurfaceContourPlot3D[x y z, {x, y, z} ∈ Sphere[], PlotLabel -> t, PlotTheme -> t, ImageSize -> 130], {t, {"Scientific", "Monochrome", "Minimal", "Web", "Working", "Classic", "Business", "Marketing", "Detailed"}}]RegionFunction (2)
Include only the contours where ![]() or
or ![]() :
:
SurfaceContourPlot3D[x y z, {x, y, z} ∈ Sphere[], RegionFunction -> Function[{x, y, z}, x < 0 || y > 0]]Include only the contours where ![]() :
:
SurfaceContourPlot3D[x ^ 2 + y ^ 2 + z ^ 2, {x, y, z} ∈ Cube[2], RegionFunction -> Function[{x, y, z, f}, f > 2]]Ticks (6)
Ticks are placed automatically in each plot:
SurfaceContourPlot3D[x y, {x, y, z} ∈ Sphere[]]Use TicksNone to not draw any tick marks:
SurfaceContourPlot3D[x y, {x, y, z} ∈ Sphere[], Ticks -> None]Place tick marks at specific positions:
SurfaceContourPlot3D[x y, {x, y, z} ∈ Sphere[{0, 0, 0}, 2], Ticks -> {{-1.5, 0, 1.5}, {-1.5, 0, 1.5}, {-1.5, 0, 1.5}}]Draw tick marks at the specified positions with the specified labels:
SurfaceContourPlot3D[x y, {x, y, z} ∈ Sphere[{0, 0, 0}, 2], Ticks -> {{{-1.5, -a}, {0, 0}, {1.5, a}}, {{-1.5, -a}, {0, 0}, {1.5, a}}, {{-1.5, -a}, {0, 0}, {1.5, a}}}]Specify tick marks with scaled lengths:
SurfaceContourPlot3D[x y, {x, y, z} ∈ Sphere[{0, 0, 0}, 2], Ticks -> {{{-1.5, -a, .1}, {0, 0, .1}, {1.5, a, .1}}, {{-1.5, -a, .05}, {0, 0, .05}, {1.5, a, .05}}, {{-1.5, -a, .15}, {0, 0, .15}, {1.5, a, .15}}}]Customize each tick with position, length, labeling and styling:
SurfaceContourPlot3D[x y, {x, y, z} ∈ Sphere[{0, 0, 0}, 2], Ticks -> {{{-1.5, -a, .1, Directive[Red, Dashed, Thick]}, {0, 0, .1, Directive[Red, Dashed]}, {1.5, a, .1, Directive[Red]}}, {{-1.5, -a, .05, Directive[Blue, Dashed, Thick]}, {0, 0, .05, Directive[Blue, Dashed]}, {1.5, a, .05, Directive[Blue]}}, {{-1.5, -a, .15, Directive[Darker@Green, Dashed, Thick]}, {0, 0, .15, Directive[Darker@Green, Dashed]}, {1.5, a, .15, Directive[Darker@Green]}}}]TicksStyle (3)
By default, the ticks and tick labels use the same styles as the axis:
SurfaceContourPlot3D[x y, {x, y, z} ∈ Sphere[{0, 0, 0}, 2], AxesStyle -> Directive[Bold, Red]]Specify overall ticks style, including the tick labels:
SurfaceContourPlot3D[x y, {x, y, z} ∈ Sphere[{0, 0, 0}, 2], TicksStyle -> Directive[Bold, Red]]Specify tick style for each of the axes:
SurfaceContourPlot3D[x y, {x, y, z} ∈ Sphere[{0, 0, 0}, 2], TicksStyle -> {Directive[Green, Bold], Directive[Bold, Red], Directive[Bold, Blue]}]Applications (1)
Retrieve the epicenter locations of earthquakes in California:
dat = GeoPositionXYZ[EarthquakeData[["CA"], 4, {{1980, 1, 1}, {2014, 12, 31}}, "Position"]["Values"]][[1]];Make a smooth kernel distribution of the earthquake epicenters:
𝒟 = SmoothKernelDistribution[dat, "Silverman"];Show the results on a map with the epicenters themselves shown as red dots:
Show[{SurfaceContourPlot3D[PDF[𝒟, p] ^ (1 / 5), p ∈ Polygon[["CA"]], Contours -> 15, ColorFunction -> ColorData["TemperatureMap"]], Graphics3D[{PointSize[.01], Red, Point[dat]}]}]Text
Wolfram Research (2025), SurfaceContourPlot3D, Wolfram Language function, https://reference.wolfram.com/language/ref/SurfaceContourPlot3D.html.
CMS
Wolfram Language. 2025. "SurfaceContourPlot3D." Wolfram Language & System Documentation Center. Wolfram Research. https://reference.wolfram.com/language/ref/SurfaceContourPlot3D.html.
APA
Wolfram Language. (2025). SurfaceContourPlot3D. Wolfram Language & System Documentation Center. Retrieved from https://reference.wolfram.com/language/ref/SurfaceContourPlot3D.html