

UnitRootTest
UnitRootTest[data]
测试数据是否来自具有单位根的自回归时间序列过程.
UnitRootTest[data,model,"property"]
返回给定模型的 "property" 值.
更多信息和选项
- UnitRootTest 对时间序列 data 执行假设检验,其中零假设
 为满足 AR 模型的时间序列在相应的传递函数的分母中有一个单位根,而置换假设
 则相反.
- 拒绝零假设允许去掉趋势的 data 可能来自平稳时间序列的结论.
- 默认情况下,返回概率值或者
 值.
- 较小的
 值表明单位根的存在是不可能的.
- data 可以是数值列表 {x1,x2,…,xn} 或者 TemporalData 对象.
- model 允许模型指定
 ,其中
 是常量偏移,
 是线性 drift,而
 是AR 模型的阶数.
- 可以使用下列 model 指定:
-
Automatic  和
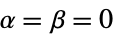
r 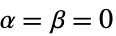
"Constant"  和

"Drift" 
{"Constant",r} 
{"Drift", r} 一般情况 - UnitRootTest[data] 将选择 Dickey–Fuller F 检验,其中
 并且
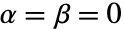 .
- UnitRootTest[data,model,All] 将选项所有应用于 data 和 model 的检验.
- UnitRootTest[data,model,"test"] 报告
 值,根据 "test".
- 可以使用下列检验:
-
"DickeyFullerF" 基于 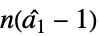
"DickeyFullerT" 基于 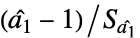
"PhillipsPerronF" 经过调整的 Dickey–Fuller F 检验 "PhillipsPerronT" 经过调整的 Dickey–Fuller T 检验 - UnitRootTest[data,model,"HypothesisTestData"] 返回 HypothesisTestData 对象 htd,它可以用于使用格式 htd["property"] 提取额外检验结果和属性.
- UnitRootTest[data,model,"property"] 用于直接给出 "property" 的值.
- 与检验结果报告相关的属性包括:
-
"AllTests" 所有可用检验列表 "AutomaticTest" 如果使用 Automatic 所选的检验 "PValue"  值检验
"PValueTable"  值的格式化表格
"ShortTestConclusion" 检验结论的简单说明 "TestConclusion" 检验结论的说明 "TestData" 检验统计量与  值的数对列表
"TestDataTable"  值与检验统计量的格式化表格
"TestStatistic" 检验统计量的列表 "TestStatisticTable" 检验统计量的格式化表格 - 可以使用下列选项:
-
SignificanceLevel 0.05 诊断和报告的截止值 - 对于单位根检验,所选择的截止值
 使得
 仅在
 时被拒绝. 用于 "TestConclusion" 和 "ShortTestConclusion" 性质的
 值由 SignificanceLevel 选项控制. 默认情况下,
 设置为 0.05.
范例
打开所有单元 关闭所有单元基本范例 (1)
范围 (17)
检验 (13)
ur = RandomFunction[ARProcess[{1}, 1, {}], {1, 50}];
nur = RandomFunction[ARProcess[{.1}, 1, {}], {1, 50}];ListLinePlot[{ur, nur}]
UnitRootTest[ur]
UnitRootTest[nur]测试单位根,零假设为内在模型是 ARProcess[2]:
ur = RandomFunction[ARProcess[{.1, 1}, 1, {}], {1, 50}];
nur = RandomFunction[ARProcess[{.1, .2}, 1, {}], {1, 50}];UnitRootTest[ur, 2]UnitRootTest[nur, 2]把模型设为 Automatic 等价于假定内在 ARProcess[1]:
data = TemporalData[Automatic, {{{0.12080196815318041, -0.06688366570017693, -1.2957111980920009,
    -2.9774228229447464, -1.936483224346861, 0.2653444024410029, -0.6137847762062091,
    0.08488003170612979, 1.8972841613244074, 0.5948279925506049, 1.24 ... 2.605072874506309, -1.8775668149620162,
    -0.17895918358007856, 0.5015420616914787, -1.728999610172087, -0.28147177421407754,
    0.92385660888113, -1.7791121063428887}}, {{2, 50, 1}}, 1, {"Discrete", 1}, {"Discrete", 1}, 1,
{}}, False, 9.];UnitRootTest[data, Automatic]UnitRootTest[data, 1]ur = TemporalData[TimeSeries, {{{12.669210728975948, 11.147532938592462, 10.36137502036138,
11.294302438388062, 10.144318288340818, 10.78817957063425, 10.113645586607637,
10.781991664579685, 10.751666830954917, 11.367131844577779, 12.827248608 ... 5, 10.81111082113405, 10.798034723293364,
10.019933103498746, 10.02711894026322, 9.180635524588123}}, {{1, 50, 1}}, 1, {"Continuous", 1},
{"Discrete", 1}, 1, {ResamplingMethod -> {"Interpolation", InterpolationOrder -> 1}}}, False,
10.1];
nur = TemporalData[TimeSeries, {{{12.108088025764935, 12.348663110304482, 12.266807499045251,
11.35686449617092, 10.592856666744847, 11.618726232556984, 13.224894851147166,
10.454523657843609, 10.093856790202144, 10.73294791686245, 12.398504969 ... 12.853165158365425,
11.325885303289883, 12.601799259304936, 10.53850213554701, 11.067692295323619}}, {{0, 50, 1}},
1, {"Continuous", 1}, {"Discrete", 1}, 1,
{ResamplingMethod -> {"Interpolation", InterpolationOrder -> 1}}}, False, 10.1];ListLinePlot[{ur, nur}]UnitRootTest[ur, "Constant"]UnitRootTest[nur, "Constant"]考虑非零均值,假定内在 ARProcess[3]:
ur = TemporalData[TimeSeries, {{{12.485678723048764, 12.457707590631347, 12.356220089205198,
    13.202731103419909, 14.15790117887235, 13.369088747576946, 13.686129901032121,
    15.562052318905486, 13.477152743543279, 12.894300687659976, 15.78432979 ... 6, 31.86919424179177, 35.806873269537576,
    33.012097684471094, 35.33324159535671, 39.81860874704464}}, {{1, 50, 1}}, 1, {"Continuous", 1},
  {"Discrete", 1}, 1, {ResamplingMethod -> {"Interpolation", InterpolationOrder -> 1}}}, False,
 10.1];
nur = TemporalData[TimeSeries, {{{12.716950850559492, 11.95044250428509, 10.239561344853092,
    11.72656521106882, 12.258204212747586, 13.243847939540128, 11.04167321295747,
    12.301901824122686, 10.532506915260647, 11.308588800343228, 10.7900291488 ... 2.761255020828647, 12.274914760360042,
    14.145051929943186, 13.231660099434027, 12.581527923796884}}, {{1, 50, 1}}, 1,
  {"Continuous", 1}, {"Discrete", 1}, 1,
{ResamplingMethod -> {"Interpolation", InterpolationOrder -> 1}}}, False, 10.1];ListLinePlot[{ur, nur}]UnitRootTest[ur, {"Constant", 3}]UnitRootTest[nur, {"Constant", 3}]ur = TemporalData[TimeSeries, {{{1.2848245440261796, -0.3425454491225972, -2.76974156128997,
-4.28152382269845, -3.466734405917938, -4.241951864844546, -6.0495910671581985,
-7.540151519354481, -7.904587183717497, -7.479374483717812, -6.4642786 ... , -23.13501856584834, -23.346914266870634, -21.084171068031523,
-20.38473263253364, -22.38357597509195}}, {{2, 50, 1}}, 1, {"Discrete", 1}, {"Discrete", 1}, 1,
{ResamplingMethod -> {"Interpolation", InterpolationOrder -> 1}}}, False, 10.1];
nur = TemporalData[TimeSeries, {{{0.12080196815318041, -0.06688366570017693, -1.2957111980920009,
-2.9774228229447464, -1.936483224346861, 0.2653444024410029, -0.6137847762062091,
0.08488003170612979, 1.8972841613244074, 0.5948279925506049, 1.2 ... 6, 0.5015420616914787, -1.728999610172087, -0.28147177421407754,
0.92385660888113, -1.7791121063428887}}, {{2, 50, 1}}, 1, {"Discrete", 1}, {"Discrete", 1}, 1,
{ResamplingMethod -> {"Interpolation", InterpolationOrder -> 1}}}, False, 10.1];ListLinePlot[{ur, nur}]UnitRootTest[ur, "Drift"]UnitRootTest[nur, "Drift"]假定非零均值、确定性趋势和内在 ARProcess[3]:
ur = TemporalData[TimeSeries, {{{-1.305992036096837, -1.827112945351831, -2.1627097621522844,
    -4.1622428986699935, -5.416012523749417, -4.412350911989915, -6.1615871731067156,
    -7.869740942464865, -8.747501968637927, -9.770749112374157, -11.180 ... 47894, 44.95789309221341, 49.564527080634306, 56.2129728017528, 60.89754035165855,
    67.39669645439203}}, {{1, 50, 1}}, 1, {"Continuous", 1}, {"Discrete", 1}, 1,
  {ResamplingMethod -> {"Interpolation", InterpolationOrder -> 1}}}, False, 10.1];
nur = TemporalData[TimeSeries, {{{-0.28569174800540664, 0.06634171992161181, 0.2995498246638215,
    1.6598569098953797, 2.1331705273903094, 1.9473913219044103, 1.4839968109419297,
    1.3870693896944284, 1.545094711696973, 2.4437273921723395, 1.749162 ... 0507503958111055, -4.4776801587036745,
    -5.333597555288771, -6.175715534490002, -6.379450169957219}}, {{1, 50, 1}}, 1,
  {"Continuous", 1}, {"Discrete", 1}, 1,
{ResamplingMethod -> {"Interpolation", InterpolationOrder -> 1}}}, False, 10.1];ListLinePlot[{ur, nur}]UnitRootTest[ur, {"Drift", 3}]UnitRootTest[nur, {"Drift", 3}]data = TemporalData[TimeSeries, {{{-1.2593135604759231, -1.2337826909137528, -0.7638166378937818,
-1.4449728297725644, -1.9674559904020306, -2.8822228243276933, -3.3574235160922132,
-0.8140416418708107, 0.6215268695933782, -0.16597774939340448, ... 668776681318445, -15.857838034224033, -15.812986166672088, -16.091212276637293,
-15.747099928115142}}, {{1, 100, 1}}, 1, {"Continuous", 1}, {"Discrete", 1}, 1,
{ResamplingMethod -> {"Interpolation", InterpolationOrder -> 1}}}, False, 10.1];UnitRootTest[data, Automatic, "DickeyFullerT"]UnitRootTest[data, Automatic, {"DickeyFullerF", "DickeyFullerT"}]使用 Automatic 应用 Dickey–Fuller F 测试:
data = TemporalData[TimeSeries, {{{-1.2593135604759231, -1.2337826909137528, -0.7638166378937818,
    -1.4449728297725644, -1.9674559904020306, -2.8822228243276933, -3.3574235160922132,
    -0.8140416418708107, 0.6215268695933782, -0.16597774939340448,  ... 668776681318445, -15.857838034224033, -15.812986166672088, -16.091212276637293,
    -15.747099928115142}}, {{1, 100, 1}}, 1, {"Continuous", 1}, {"Discrete", 1}, 1,
{ResamplingMethod -> {"Interpolation", InterpolationOrder -> 1}}}, False, 10.1];UnitRootTest[data, Automatic, Automatic]属性 "AutomaticTest" 可用以确定选择何种测试:
UnitRootTest[data, Automatic, "AutomaticTest"]data = TemporalData[Automatic, {{{-0.4816218166541434, -0.16358165397436036, -0.7377817993238698,
-0.42830032446761085, -0.8050227679192111, -1.6764207815550347, -3.168841102281171,
-3.5451201343585863, -4.356842637815697, -4.2959833430028045, - ... 57,
12.7723293696119, 12.810533366015934, 11.440254314747376, 13.050176335465256,
12.81022609114599, 11.69008267151061, 11.061560824470149, 12.539224254276276}}, {{1, 100, 1}},
1, {"Continuous", 1}, {"Discrete", 1}, 1, {}}, False, 9.];UnitRootTest[data, Automatic, All]UnitRootTest[data, Automatic, "AllTests"]创建 HypothesisTestData 对象,用于重复属性提取:
data = TemporalData[Automatic, {{{-0.7402714131343842, -1.9951233123067933, -1.523976721043832,
    -1.2910834619604106, -0.9373249140527381, 0.07332573183193847, 1.671820974185617,
    2.395217958334371, 2.6147472293342484, 2.1237526266493236, 1.670046 ... 307, 11.02809306099669, 12.903224380161044, 14.651432228049682,
    14.619485410017823, 15.195180841622236, 14.97128537275672, 15.746556528211672,
15.829432172209756}}, {{1, 100, 1}}, 1, {"Continuous", 1}, {"Discrete", 1}, 1, {}}, False, 9.];ℋ = UnitRootTest[data, Automatic, "HypothesisTestData"];ℋ["Properties"]从 HypothesisTestData 对象提取某些属性:
data = TemporalData[Automatic, {{{-0.7402714131343842, -1.9951233123067933, -1.523976721043832,
    -1.2910834619604106, -0.9373249140527381, 0.07332573183193847, 1.671820974185617,
    2.395217958334371, 2.6147472293342484, 2.1237526266493236, 1.670046 ... 307, 11.02809306099669, 12.903224380161044, 14.651432228049682,
    14.619485410017823, 15.195180841622236, 14.97128537275672, 15.746556528211672,
15.829432172209756}}, {{1, 100, 1}}, 1, {"Continuous", 1}, {"Discrete", 1}, 1, {}}, False, 9.];ℋ = UnitRootTest[data, Automatic, "HypothesisTestData"];来自 "DickeyFullerT" 检验的  值和检验统计量:
ℋ["PValue", "DickeyFullerT"]ℋ["TestStatistic", "DickeyFullerT"]data = TemporalData[Automatic, {{{-0.7402714131343842, -1.9951233123067933, -1.523976721043832,
-1.2910834619604106, -0.9373249140527381, 0.07332573183193847, 1.671820974185617,
2.395217958334371, 2.6147472293342484, 2.1237526266493236, 1.670046 ... 307, 11.02809306099669, 12.903224380161044, 14.651432228049682,
14.619485410017823, 15.195180841622236, 14.97128537275672, 15.746556528211672,
15.829432172209756}}, {{1, 100, 1}}, 1, {"Continuous", 1}, {"Discrete", 1}, 1, {}}, False, 9.];ℋ = UnitRootTest[data, Automatic, "HypothesisTestData"];来自 Dickey–Fuller F 检验的  值和检验统计量:
ℋ[{"PValue", "DickeyFullerF"}, {"TestStatistic", "DickeyFullerF"}]报告 (4)
data = TemporalData[Automatic, {{{-1.0478070046374428, -0.2423815332244802, -2.0504136353778026,
    -0.21740382107897993, -0.9208690650265103, -2.026742935027657, -2.7997550914481533,
    -3.3436538898130945, -3.8029151219695976, -6.0702838188126, -7.7 ... 497664549511276, -11.000282580085628, -10.520093525498497,
    -9.753505073507291, -11.577684742186381, -12.198378006290703, -13.164722402230339,
-12.742400902262268}}, {{1, 100, 1}}, 1, {"Continuous", 1}, {"Discrete", 1}, 1, {}}, False, 9.];ℋ = UnitRootTest[data, 1, "HypothesisTestData"];ℋ["TestDataTable", All]ℋ["TestDataTable", "DickeyFullerF"]data = TemporalData[TimeSeries, {{{-0.7138699376248646, -0.04661937649389336, 0.6284601334264334,
-0.4612551845391224, -0.6487660911263642, -1.5231501464086439, -0.9606961402193632,
-0.013453384435565097, 1.9775061882189524, 4.422462003662958, 6 ... 745, 4.740835796718794, 6.927584681291996, 8.76987961793021, 11.003943117660214,
14.600138422017785}}, {{1, 100, 1}}, 1, {"Continuous", 1}, {"Discrete", 1}, 1,
{ResamplingMethod -> {"Interpolation", InterpolationOrder -> 1}}}, False, 10.1];ℋ = UnitRootTest[data, 1, "HypothesisTestData"];res = ℋ["TestData", All];tests = ℋ["AllTests"]

Show[BarChart[res[[All, 2]], ChartLabels -> Placed[tests, Center], BarOrigin -> Left], Graphics[Line[{{.05, 0}, {.05, Length[tests] + 1}}]]]
data = TemporalData[Automatic, {{{-1.0478070046374428, -0.2423815332244802, -2.0504136353778026,
    -0.21740382107897993, -0.9208690650265103, -2.026742935027657, -2.7997550914481533,
    -3.3436538898130945, -3.8029151219695976, -6.0702838188126, -7.7 ... 497664549511276, -11.000282580085628, -10.520093525498497,
    -9.753505073507291, -11.577684742186381, -12.198378006290703, -13.164722402230339,
-12.742400902262268}}, {{1, 100, 1}}, 1, {"Continuous", 1}, {"Discrete", 1}, 1, {}}, False, 9.];ℋ = UnitRootTest[data, 1, "HypothesisTestData"];ℋ["PValueTable", "DickeyFullerF"]
ℋ["PValue", "DickeyFullerF"]
ℋ["PValueTable", All]
ℋ["PValueTable", {"DickeyFullerF", "PhillipsPerronF"}]data = TemporalData[TimeSeries, {{{-1.5936910465744076, -3.357349273906714, -3.965028990320997,
-4.362056613886581, -4.349200453034948, -3.7079978676383623, -4.785830326726696,
-4.690633297205321, -5.820620838560659, -6.2522757649255425, -5.6428 ... 0.77026211545831, -10.88669814649508, -11.562651569377277, -11.827959381986176,
-14.565035100006956}}, {{1, 100, 1}}, 1, {"Continuous", 1}, {"Discrete", 1}, 1,
{ResamplingMethod -> {"Interpolation", InterpolationOrder -> 1}}}, False, 10.1];ℋ = UnitRootTest[data, "Drift", "HypothesisTestData"];ℋ["TestStatisticTable"]ℋ["TestStatistic"]ℋ["TestStatisticTable", All]选项 (1)
SignificanceLevel (1)
用于 "TestConclusion" 和 "ShortTestConclusion" 的显著性水平:
data = Table[10 i ^ (-.1), {i, 10}];ℋ1 = UnitRootTest[data, 1, "HypothesisTestData", SignificanceLevel -> .001];ℋ2 = UnitRootTest[data, 1, "HypothesisTestData", SignificanceLevel -> .005];ℋ1["TestConclusion", "DickeyFullerT"]//TraditionalFormℋ2["TestConclusion", "DickeyFullerT"]//TraditionalFormℋ1["ShortTestConclusion", "DickeyFullerT"]ℋ2["ShortTestConclusion", "DickeyFullerT"]应用 (3)
记录澳大利亚悉尼 47 年内最大日降雨量. 令人感兴趣的是一个简单的自回归模型是否可以对该数据建模:
data = ExampleData[{"Statistics", "AustraliaRainfall"}];ListLinePlot[data, Filling -> Axis]使用 Schwert 定理选择内在 ARProcess 的阶数:
pmax[n_] := IntegerPart[12((n/100))^1 / 4]i = pmax[Length[data]];
While[Abs[UnitRootTest[data, {"Constant", i}, {"TestStatistic", "DickeyFullerT"}]] < 1.6, i--
];
i这是单位根的证据,表明一个简单的 ARProcess 不是一个正确的模型:
UnitRootTest[data, {"Constant", i}, "DickeyFullerT"]考虑美国商业航空公司1937年至1960年的年营业收入(以百万计):
revenue = ExampleData[{"Statistics", "AirlinePassengerMiles"}, "TimeSeries"];p1 = ListStepPlot[revenue, Filling -> Axis]用 UnitRootTest 来确认这个趋势:
UnitRootTest[revenue, "Drift"]UnitRootTest[Differences[revenue["PathStates"], 1]]对时间序列做 ARIMAProcess 拟合:
eproc = EstimatedProcess[revenue, ARIMAProcess[2, 1, 2]]forecast = TimeSeriesForecast[eproc, revenue, {10}]ListStepPlot[{revenue, forecast}, Filling -> Axis]sp500 = TemporalData[TimeSeries, {{{1459.37, 1466.47, 1461.89, 1457.15, 1461.02, 1472.12, 1472.05, 1470.68,
1472.34, 1472.63, 1480.94, 1485.98, 1492.56, 1494.81, 1494.82, 1502.96, 1500.18, 1507.84,
1501.96, 1498.11, 1513.17, 1495.71, 1511.29, 151 ... {TemporalData`DateSpecification[{2013, 1, 3}, {2013, 12, 2}, "BusinessDay", "DayRange"]}, 1,
{"Discrete", 1}, {"Discrete", 1}, 1,
{MetaInformation -> {"Source" -> Defer[FinancialData["SP500", {{2013, 1, 3}, {2013, 12, 1}}]]}}},
True, 10.];sp500["Source"]DateListPlot[sp500, Filling -> Axis]UnitRootTest[sp500, 2, "ShortTestConclusion"]eproc = EstimatedProcess[sp500, ARIMAProcess[2, 1, 1]]forecast = TimeSeriesForecast[eproc, sp500, {26}];DateListPlot[{sp500, forecast}, Filling -> Axis]可能存在的问题 (2)
Phillips–Perron 检验局限于ARProcess[1] 模型:
data = RandomFunction[ARProcess[{.1, .2, .3}, 1], {0, 25}];UnitRootTest[data, 2, "PhillipsPerronF"]
使用 Dickey–Fuller 类型检验来测试较高的阶数:
UnitRootTest[data, 2, "DickeyFullerF"]UnitRootTest 对于不规则采样数据失效:
sp500 = ExampleData[{"Statistics", "SP500"}, "TimeSeries"]RegularlySampledQ[sp500]UnitRootTest[sp500]
UnitRootTest[sp500["Values"]]或者设置 TemporalRegularity 为真:
UnitRootTest[TimeSeries[sp500, TemporalRegularity -> True]]巧妙范例 (2)
对于样本量100,模拟 Dickey–Fuller T 分布的近似:
data = Table[RandomFunction[ARProcess[{1}, 1, {}], {0, 100}], {10000}];dfdata = Table[UnitRootTest[i, 1, {"TestStatistic", "DickeyFullerT"}], {i, data}];Histogram[dfdata]
{t, p} = UnitRootTest[First[data], 1, {"TestData", "DickeyFullerT"}]Probability[x ≤ t, xdfdata]//Ndata = Table[RandomFunction[ARProcess[{1}, 1, {}], {0, 100}], {1000}];ℋ = Map[UnitRootTest[#1, 1, "HypothesisTestData"]&, data];T = Transpose@Table[h["TestStatistic", i], {h, ℋ}, {i, tests = {"DickeyFullerF", "DickeyFullerT", "PhillipsPerronF", "PhillipsPerronT"}}];Table[SmoothHistogram[T[[i]], PlotRange -> All, PlotLabel -> tests[[i]], Filling -> Axis, ImageSize -> 200], {i, 4}]文本
Wolfram Research (2012),UnitRootTest,Wolfram 语言函数,https://reference.wolfram.com/language/ref/UnitRootTest.html.
CMS
Wolfram 语言. 2012. "UnitRootTest." Wolfram 语言与系统参考资料中心. Wolfram Research. https://reference.wolfram.com/language/ref/UnitRootTest.html.
APA
Wolfram 语言. (2012). UnitRootTest. Wolfram 语言与系统参考资料中心. 追溯自 https://reference.wolfram.com/language/ref/UnitRootTest.html 年