"ClassDistributions" (機械学習メソッド)
"ClassDistributions" (機械学習メソッド)
- Classifyのためのメソッドである.
- クラス確率を計算するために各クラスの確率分布を学習する.
詳細とサブオプション
- "ClassDistribution"メソッドは,このクラスの例にLearnDistributionを適用することで各クラスについての確率分布を学ぶ. 新たな例が分類のために渡されると,各クラス分布について例の確率密度関数(PDF)を測定することで例のクラス確率が計算される.より正確には,確率はベイズの定理
 を使って計算される.ただし,x は分類する例,
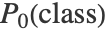 はクラスの事前確率,
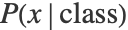 はクラス分布についての x のPDFである.
- 次は,使用可能なオプションである.
-
Method Automatic LearnDistributionが使用するメソッド - Methodmethod の method は,LearnDistributionの任意のメソッドでよい.オプションとサブオプションが指定できるかもしれない.
- Classify[…,AnomalyDetectorInherited]を使って,異常な例を検出するためにこのメソッドが学んだ陰的混合分布を使うことができる.
例題
すべて開く すべて閉じる例 (3)
c = Classify[{1, 2, 3, 4} -> {1, 1, 2, 2}, Method -> "ClassDistributions"]c[1.3]c[1.3, "Probabilities"]Information[c]LearnDistributionが使ったメソッドについての特定の情報を得る:
Information[c, "MethodOption"]sampledata[center_] := RandomVariate[MultinormalDistribution[center, IdentityMatrix[2]], 200];clusters = sampledata /@ {{1.5, 1}, {-1.5, 1}, {0, -3}};ListPlot[clusters, PlotStyle -> Darker@{Yellow, Blue, Green}]c = Classify[<|Yellow -> clusters[[1]], Blue -> clusters[[2]], Green -> clusters[[3]]|>, Method -> "LogisticRegression"]各クラスの訓練集合と確率分布を特徴の関数としてプロットする:
Show[
	Plot3D[{
	c[{x, y}, "Probability" -> Yellow],
	c[{x, y}, "Probability" -> Blue],
	c[{x, y}, "Probability" -> Green]},
	{x, -4, 4}, {y, -5, 4},
Exclusions -> None], ListPointPlot3D[Map[Append[#, 1]&, clusters, {2}], PlotStyle -> {Yellow, Blue, Green}]]分類器関数を訓練し,"ClassDistributions"メソッドから異常検出器を継承するように指定する:
c = Classify[{1, 2, 3, 4} -> {"A", "A", "B", "B"}, Method -> "ClassDistributions", AnomalyDetector -> Inherited]c[3.2]c[10]オプション (1)
Method (1)
分類器関数を訓練し,LearnDistributionの"KernelDensityEstimation" メソッドを使うように指定する:
c = Classify[{1, 2, 3, 4} -> {"A", "A", "B", "B"}, Method -> {"ClassDistributions", Method -> "KernelDensityEstimation"}]c[2.3, "Probabilities"]別の分類器を訓練し,"KernelDensityEstimation"メソッドのいくつかのオプションを指定する:
c2 = Classify[{1, 2, 3, 4} -> {"A", "A", "B", "B"}, Method -> {"ClassDistributions", Method -> {"KernelDensityEstimation", "NeighborsNumber" -> 2}}]c2[2.3, "Probabilities"]
 An Elementary Introduction to the Wolfram Language