

InteractiveTradingChart
Listing of Financial Indicators »InteractiveTradingChart[{{date1,{open1,high1,low1,close1,volume1}},…}]
makes a chart showing prices and volume for each date.
InteractiveTradingChart[{"name",daterange}]
makes a financial chart for the financial entity "name" over the daterange.
InteractiveTradingChart[{…},{ind1,ind2,…}]
makes a financial chart with indicators ind1, ind2, … .
Details and Options
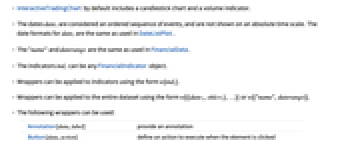
- InteractiveTradingChart by default includes a candlestick chart and a volume indicator.
- The dates datei are considered an ordered sequence of events, and are not shown on an absolute time scale. The date formats for datei are the same as used in DateListPlot.
- The "name" and daterange are the same as used in FinancialData.
- The indicators indi can be any FinancialIndicator object.
- Wrappers can be applied to indicators using the form w[indi].
- Wrappers can be applied to the entire dataset using the form w[{{date1,ohlcv1},…}] or w[{"name",daterange}].
- InteractiveTradingChart[Tabular[…]cspec] extracts and plots values from the tabular object using the column specification cspec.
- The following forms of column specifications cspec are allowed for plotting tabular data:
-
{coldate,{colopen,colhigh,collow,colclose,colvol}} plot values from columns {colopen,…,colvol} against dates from coldate - The following wrappers can be used:
-
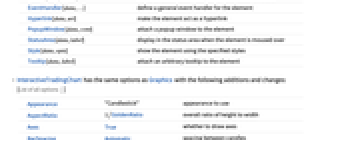
Annotation[data,label] provide an annotation Button[data,action] define an action to execute when the element is clicked EventHandler[data,…] define a general event handler for the element Hyperlink[data,uri] make the element act as a hyperlink PopupWindow[data,cont] attach a popup window to the element StatusArea[data,label] display in the status area when the element is moused over Style[data,opts] show the element using the specified styles Tooltip[data,label] attach an arbitrary tooltip to the element - InteractiveTradingChart has the same options as Graphics with the following additions and changes: [List of all options]
-
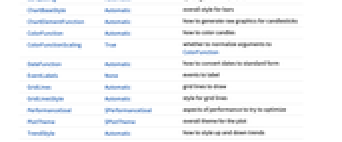
Appearance "Candlestick" appearance to use AspectRatio 1/GoldenRatio overall ratio of height to width Axes True whether to draw axes BarSpacing Automatic spacing between candles ChartBaseStyle Automatic overall style for bars ChartElementFunction Automatic how to generate raw graphics for candlesticks ColorFunction Automatic how to color candles ColorFunctionScaling True whether to normalize arguments to ColorFunction DateFunction Automatic how to convert dates to standard form EventLabels None events to label GridLines Automatic grid lines to draw GridLinesStyle Automatic style for grid lines PerformanceGoal $PerformanceGoal aspects of performance to try to optimize PlotTheme $PlotTheme overall theme for the plot TrendStyle Automatic how to style up and down trends ScalingFunctions None how to scale the  axis
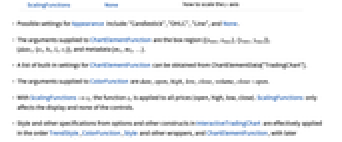
axis - Possible settings for Appearance include: "Candlestick", "OHLC", "Line", and None.
- The arguments supplied to ChartElementFunction are the box region {{xmin,xmax},{ymin,ymax}}, the values {datei,{oi,hi,li,ci}} and metadata {m1,m2,…}.
- A list of built-in settings for ChartElementFunction can be obtained from ChartElementData["TradingChart"].
- The arguments supplied to ColorFunction are date,open,high,low,close,volume,close-open.
- With ScalingFunctions->sy the function sy is applied to all prices (open, high, low, close). ScalingFunctions only affects the display and none of the controls.
- Style and other specifications from options and other constructs in InteractiveTradingChart are effectively applied in the order TrendStyle, ColorFunction, Style and other wrappers, and ChartElementFunction, with later specifications overriding earlier ones.
-
 Highlight options with settings specific to InteractiveTradingChart
-
AlignmentPoint Center the default point in the graphic to align with Appearance "Candlestick" appearance to use AspectRatio 1/GoldenRatio overall ratio of height to width Axes True whether to draw axes AxesLabel None axes labels AxesOrigin Automatic where axes should cross AxesStyle {} style specifications for the axes Background None background color for the plot BarSpacing Automatic spacing between candles BaselinePosition Automatic how to align with a surrounding text baseline BaseStyle {} base style specifications for the graphic ChartBaseStyle Automatic overall style for bars ChartElementFunction Automatic how to generate raw graphics for candlesticks ColorFunction Automatic how to color candles ColorFunctionScaling True whether to normalize arguments to ColorFunction ContentSelectable Automatic whether to allow contents to be selected CoordinatesToolOptions Automatic detailed behavior of the coordinates tool DateFunction Automatic how to convert dates to standard form Epilog {} primitives rendered after the main plot EventLabels None events to label FormatType TraditionalForm the default format type for text Frame False whether to put a frame around the plot FrameLabel None frame labels FrameStyle {} style specifications for the frame FrameTicks Automatic frame ticks FrameTicksStyle {} style specifications for frame ticks GridLines Automatic grid lines to draw GridLinesStyle Automatic style for grid lines ImageMargins 0. the margins to leave around the graphic ImagePadding All what extra padding to allow for labels etc. ImageSize Automatic the absolute size at which to render the graphic LabelStyle {} style specifications for labels Method Automatic details of graphics methods to use PerformanceGoal $PerformanceGoal aspects of performance to try to optimize PlotLabel None an overall label for the plot PlotRange All range of values to include PlotRangeClipping False whether to clip at the plot range PlotRangePadding Automatic how much to pad the range of values PlotRegion Automatic the final display region to be filled PlotTheme $PlotTheme overall theme for the plot PreserveImageOptions Automatic whether to preserve image options when displaying new versions of the same graphic Prolog {} primitives rendered before the main plot RotateLabel True whether to rotate y labels on the frame ScalingFunctions None how to scale the  axis
axisTicks Automatic axes ticks TicksStyle {} style specifications for axes ticks TrendStyle Automatic how to style up and down trends
List of all options
Text
Wolfram Research (2010), InteractiveTradingChart, Wolfram Language function, https://reference.wolfram.com/language/ref/InteractiveTradingChart.html (updated 2025).
CMS
Wolfram Language. 2010. "InteractiveTradingChart." Wolfram Language & System Documentation Center. Wolfram Research. Last Modified 2025. https://reference.wolfram.com/language/ref/InteractiveTradingChart.html.
APA
Wolfram Language. (2010). InteractiveTradingChart. Wolfram Language & System Documentation Center. Retrieved from https://reference.wolfram.com/language/ref/InteractiveTradingChart.html