

Quantile
Details


- Quantile is also known as value at risk (VaR) or fractile.
- When VectorQ data
 is sorted as
  , the quantile estimate
  is given by
  .
. - For MatrixQ data, the quantile is computed for each column vector with Quantile[{{x1,y1,…},{x2,y2,…},…},p] equivalent to {Quantile[{x1,x2,…},p],Quantile[{y1,y2,…},p]}. »
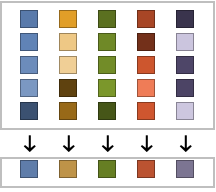
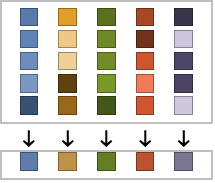
- For ArrayQ data, quantile is equivalent to ArrayReduce[Quantile,data,1]. »
- Quantile[
 ,p,{{a,b},{c,d}}] is given by
  with r=a+(n+b)p, ⌊r⌋= Floor[r], ⌈r⌉=Ceiling[r] and =FractionalPart[r]. The indices are taken to be 1 or n if they are out of range. »
 - Common choices of parameters {{a,b},{c,d}} include:
-
{{0,0},{1,0}} inverse empirical CDF (default) {{0,0},{0,1}} linear interpolation (California method) {{1/2,0},{0,0}} element numbered closest to p n {{1/2,0},{0,1}} linear interpolation (hydrologist method) {{0,1},{0,1}} mean‐based estimate (Weibull method) {{1,-1},{0,1}} mode‐based estimate {{1/3,1/3},{0,1}} median‐based estimate {{3/8,1/4},{0,1}} normal distribution estimate - The default choice of parameters is {{0,0},{1,0}}.
- About 10 different choices of parameters are in use in statistical work.
- Quantile[list,p] always gives a result equal to an element of list.
- The same is true whenever d is 0.
- When d is 1, Quantile is piecewise linear as a function of p.
- Median[data] is equivalent to Quantile[data,1/2,{{1/2,0},{0,1}}].
- The data can have the following additional forms and interpretations:
-
Association the values (the keys are ignored) » SparseArray as an array, equivalent to Normal[data] » QuantityArray quantities as an array » WeightedData based on the underlying EmpiricalDistribution » EventData based on the underlying SurvivalDistribution » TimeSeries, TemporalData, … vector or array of values (the time stamps ignored) » Image,Image3D RGB channel's values or grayscale intensity value » Audio amplitude values of all channels » DateObject, TimeObject list of dates or list of times » - Quantile[dist,p] is equivalent to InverseCDF[dist,p].
- Quantile[dist,p] is the minimum of the set of number(s)
 such that Probability[x≤
 ,xdist]≥p and Probability[x≥
 ,xdist]≥p. »
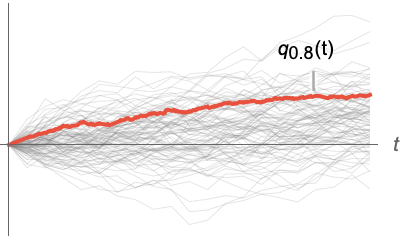
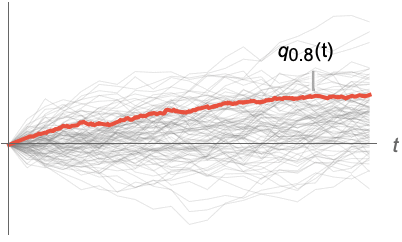
 - For a random process proc, the quantile function can be computed for slice distribution at time t, SliceDistribution[proc,t], as Quantile[SliceDistribution[proc,t], p]. »
- The value p can be symbolic or any number between 0 and 1. »


Examples
open all close allBasic Examples (7)
Scope (33)
Basic Uses (7)
Quantile works with any real numeric quantities:
Obtain results at any precision:
Compute results using other parametrizations:
Find quantiles for WeightedData:
Find quantiles for EventData:
Find a quantile for TimeSeries:
Array Data (6)
Find quantiles of elements in each column:
Find multiple quantiles of elements in each column:
The quantile for a tensor gives columnwise standard deviations at the first level:
Compute results for a large vector or matrix:
When the input is an Association, Quantile works on its values:
Compute results for a SparseArray:
Find a quantile of a QuantityArray:
Image and Audio Data (2)
Date and Time (5)
Parametric Distributions (5)
Obtain a machine-precision result:
Obtain a result at any precision for a continuous distribution:
Obtain a symbolic expression for the quantile:
Quantile threads elementwise over lists:
Nonparametric Distributions (2)
Quantile for nonparametric distributions:
Compare with the value for the underlying parametric distribution:
Derived Distributions (4)
Quantile for a truncated distribution:
Random Processes (2)
Quantile function for a random process:
Find a quantile of TemporalData at some time t=0.5:
Find the corresponding quantile function together with all the simulations:
Applications (7)
A set of ![]() equally spaced quantiles divides the values into
equally spaced quantiles divides the values into ![]() equal-sized groups:
equal-sized groups:
Plot the PDF divided according to the values of quantiles into five regions:
Use quantile as a mesh function:
Plot the q![]() quantile for a list:
quantile for a list:
The linearly interpolated quantile:
Compute an expectation using quantile ![]() :
:
Use this method in Expectation:
Generate random numbers for a nonuniform distribution by transforming the uniform distribution by the quantile function of the nonuniform distribution:
Compare the histogram of the sample with the probability density function of the desired distribution:
Compute a moving quantile for some data:
Compute selected quantiles for slices of a collection of paths of a random process:
Properties & Relations (9)
Use Quantile to find the quartiles of a distribution:
With default parameters, Quantile always returns an element of the list:
Quartiles gives linearly interpolated Quantile values for a list:
InterquartileRange is the difference of linearly interpolated Quantile values for a list:
QuartileDeviation is half the difference of linearly interpolated Quantile values for a list:
QuartileSkewness uses linearly interpolated Quantile values as a skewness measure:
Quantile is equivalent to InverseCDF for distributions:
QuantilePlot plots the quantiles of a list or distribution:
BoxWhiskerChart shows special quantiles for data:
Possible Issues (4)
For computations with data, the value p can be any number between 0 and 1:
The symbolic closed form may exist for some distributions:
Symbolic closed forms do not exist for some distributions:
Substitution of invalid values into symbolic outputs gives results that are not meaningful:
It stays unevaluated if passed as an argument:
Quartiles of data computed via Quantile do not always agree with Quartiles:
Specify linear interpolation parameters in Quantile:
Neat Examples (1)
The distribution of Quantile estimates for 20, 100, and 300 samples:
See Also
Median Quartiles Ordering Variance MedianDeviation InterquartileRange Sort ListInterpolation Nearest InverseCDF InverseSurvivalFunction OrderDistribution
Function Repository: StatisticsSummary
Tech Notes
History
Introduced in 2003 (5.0) | Updated in 2007 (6.0) ▪ 2023 (13.3) ▪ 2024 (14.1)
Text
Wolfram Research (2003), Quantile, Wolfram Language function, https://reference.wolfram.com/language/ref/Quantile.html (updated 2024).
CMS
Wolfram Language. 2003. "Quantile." Wolfram Language & System Documentation Center. Wolfram Research. Last Modified 2024. https://reference.wolfram.com/language/ref/Quantile.html.
APA
Wolfram Language. (2003). Quantile. Wolfram Language & System Documentation Center. Retrieved from https://reference.wolfram.com/language/ref/Quantile.html
BibTeX
@misc{reference.wolfram_2025_quantile, author="Wolfram Research", title="{Quantile}", year="2024", howpublished="\url{https://reference.wolfram.com/language/ref/Quantile.html}", note=[Accessed: 19-February-2026]}
BibLaTeX
@online{reference.wolfram_2025_quantile, organization={Wolfram Research}, title={Quantile}, year={2024}, url={https://reference.wolfram.com/language/ref/Quantile.html}, note=[Accessed: 19-February-2026]}