


WaveletListPlot
WaveletListPlot[dwd]
plots wavelet transform coefficients in the DiscreteWaveletData dwd.
WaveletListPlot[dwd,wind]
plots wavelet transform coefficients corresponding to the wavelet index specification wind.
WaveletListPlot[dwd,wind,func]
applies func to coefficients before plotting.
WaveletListPlot[{dwd1,dwd2,…},…]
plots wavelet transform coefficients from several DiscreteWaveletData objects dwd1, dwd2, ….
Details and Options
- WaveletListPlot works for DiscreteWaveletData coming from 1D array data.
- The wavelet index specification wind is the same as used by DiscreteWaveletData.
- WaveletListPlot[dwd] is equivalent to WaveletListPlot[dwd,Automatic].
- WaveletListPlot has the same options as ListPlot, with the following additions and changes: [List of all options]
-
AspectRatio Automatic ratio of height to width Joined True whether to join points Method Automatic what method to use PlotLayout "CommonXAxis" what layout to use for the plot PlotRange All range of values to include - ColorData["DefaultPlotColors"] gives the default sequence of colors used by PlotStyle.
- The following settings for PlotLayout can be used to display multiple sets of data:
-
"CommonXAxis" coefficients are plotted against a common  axis
axis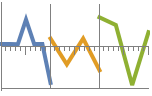
"CommonYAxis" coefficients are plotted using a common  axis
axis - With the setting "CommonXAxis", coefficients are plotted against a common horizontal
 axis where the independent
  axes are separately scaled to occupy the same amount of vertical space.
 - With the setting "CommonYAxis", coefficients are plotted using a common vertical
 axis where the independent
  axes are separately scaled to occupy the same amount of horizontal space.
 - Ticks and FrameTicks have the following settings with special interpretations in the direction perpendicular to the common axis:
-
Automatic refinement level Full full wavelet index - With the setting Method->"InverseTransform", the inverse transform of each coefficient array will be plotted.
- WaveletListPlot returns a Graphics object.
List of all options
Examples
open all close allBasic Examples (1)
Compute a discrete wavelet transform:
data = Table[2 - 5 t + 5 Exp[-500 (t - 0.5) ^ 2], {t, 0., 1., 1 / 128}];dwd = DiscreteWaveletTransform[data, Automatic, 4]Plot the different wavelet transform coefficients:
WaveletListPlot[dwd, Ticks -> Full]Plot against a common vertical axis:
WaveletListPlot[dwd, Ticks -> Full, PlotLayout -> "CommonYAxis"]Scope (16)
Data (6)
Plot wavelet coefficients used by default in the inverse wavelet transform:
dwd = StationaryWaveletTransform[Sin[Range[30]^2 / 50], Automatic, 3];WaveletListPlot[dwd]Specify which coefficients to plot:
Table[WaveletListPlot[dwd, wind, PlotLabel -> wind, Ticks -> Full], {wind, {Automatic, {___, 0}, {___, 1}, All}}]Discrete wavelet transform coefficients are spaced so as to lie on the same horizontal axis:
dwd = DiscreteWaveletTransform[Sin[Range[30]^2 / 100]];WaveletListPlot[dwd, PlotMarkers -> Automatic]Stationary wavelet transform coefficients are all the same length:
dwd = StationaryWaveletTransform[Sin[Range[30]^2 / 100]];WaveletListPlot[dwd, PlotMarkers -> Automatic]In the "CommonXAxis" layout, each coefficient is separately rescaled:
dwd = StationaryWaveletTransform[Sin[Range[20]^2 / 10]];WaveletListPlot[dwd, PlotLayout -> "CommonXAxis"]In the "CommonYAxis" layout, all coefficients are plotted on a common vertical scale:
WaveletListPlot[dwd, PlotLayout -> "CommonYAxis"]Plot multiple DiscreteWaveletData objects together:
data = Sin[Range[15]^2 / 100];dwd1 = StationaryWaveletTransform[data];dwd2 = StationaryWaveletTransform[(data + 0.1)^2 - 1];Using Filling to highlight the differences:
WaveletListPlot[{dwd1, dwd2}, Filling -> {1}, PlotLayout -> "CommonYAxis"]Apply a function to data before plotting:
dwd = StationaryWaveletTransform[Sin[Range[20]^2 / 10]];WaveletListPlot[dwd, Automatic, c Log[Abs[c]], PlotLayout -> "CommonYAxis"]Presentation (10)
Lay out coefficients vertically or horizontally with a specified common axis:
dwd = DiscreteWaveletTransform[Sin[Range[50] ^ 2 / 200]];Table[WaveletListPlot[dwd, PlotLayout -> l, PlotLabel -> l], {l, {"CommonXAxis", "CommonYAxis"}}]Label coefficients by their refinement level using the full wavelet index as a tooltip:
dwd = StationaryWaveletTransform[Sin[Range[50]^2 / 100]];WaveletListPlot[dwd, Ticks -> Automatic]Label coefficients by their full wavelet index:
WaveletListPlot[dwd, PlotLayout -> "CommonXAxis", Ticks -> Full]Curves are automatically styled to appear distinct:
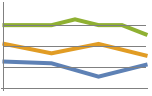
data = Sin[Range[40]^2 / 100];dwd1 = StationaryWaveletTransform[data, Automatic, 2];dwd2 = StationaryWaveletTransform[(data - 1)^2, Automatic, 2];dwd3 = StationaryWaveletTransform[data - 1, Automatic, 2];With multiple DiscreteWaveletData objects, each object is colored distinctly:
WaveletListPlot[{dwd1, dwd2, dwd3}, PlotLayout -> "CommonYAxis"]With a single DiscreteWaveletData object, each coefficient is colored distinctly:
WaveletListPlot[dwd1, Ticks -> Full]Specify an overall style applying to every coefficient:
dwd = StationaryWaveletTransform[Sin[Range[50]^2 / 100], Automatic, 2];WaveletListPlot[dwd, PlotStyle -> Dashed]Provide explicit styling to each coefficient:
WaveletListPlot[dwd, PlotStyle -> {Green, Blue, Directive[Red, Dashed]}]dwd = StationaryWaveletTransform[Sin[Range[50]^2 / 100], Automatic, 3];WaveletListPlot[dwd, PlotLabel -> "SWT"@Sin[x^2 / 100], AxesLabel -> {x, None}]dwd = StationaryWaveletTransform[Sin[Range[50]^2 / 100], Automatic, 3];WaveletListPlot[dwd, Frame -> True]Fill plots of each coefficient:
dwd = StationaryWaveletTransform[Sin[Range[50]^2 / 100], Automatic, 3];{WaveletListPlot[dwd, Filling -> Axis], WaveletListPlot[dwd, Filling -> Axis, PlotLayout -> "CommonYAxis"]}d1 = Table[Sin[x] + Cos[2 x], {x, -2 π, 2 π, (4 π) / 511}];d2 = Table[ArcSin[Sin[20 x]] / 5, {x, -2 π, 2 π, (4 π) / 511}];ListLinePlot[d1 + d2]dwd = DiscreteWaveletTransform[d1 + d2, SymletWavelet[4], 6];WaveletListPlot[dwd, DataRange -> {-2 π, 2 π}, Joined -> False, Filling -> Axis, PlotMarkers -> "", FillingStyle -> Brown, Frame -> True, AspectRatio -> 1]Plot DiscreteWaveletPacketTransform coefficients:
f[t_] := N[(4/1 + Exp[-6.4 t + 3.2]) + Cos[100 π t] Ii[t, (1/3), (2/3)]];
Ii[t_, x1_, x2_] := Piecewise[{{1, t ≥ x1 && t ≤ x2}}, 0]data = Join[Table[f[x], {x, 0, 1, (1/127)}], Reverse[Table[f[x], {x, 0, 1, (1/127)}]]];dwpt = DiscreteWaveletPacketTransform[data, Automatic, 2]dwpt["TreeView"]WaveletListPlot[dwpt, All, DataRange -> {0, 1}, Joined -> False, Filling -> Axis, TicksStyle -> Directive[FontFamily -> "Verdana"], PlotMarkers -> "", Method -> {"PlotData" -> True}, Ticks -> Full, PlotStyle -> (Directive[{Opacity[1], Thickness[0.003], #1}]&) /@ Append[ConstantArray[ColorData[14][5], 6], ColorData[14][6]]]dwd = StationaryWaveletTransform[Sin[Range[50]^2 / 100], Automatic, 3];WaveletListPlot[dwd, Frame -> True, PlotTheme -> "Marketing"]Generalizations & Extensions (1)
Plot wavelet coefficients from complex-valued data:
dwd = DiscreteWaveletTransform[Table[Re@ArcTan[x + I], {x, 0.01, 1, 0.01}], DaubechiesWavelet[], 3]Specify a real-valued function to apply to complex data before plotting:
Table[WaveletListPlot[dwd, Automatic, f, PlotLabel -> f], {f, {Arg, Im}}]By default, Re is applied:
{WaveletListPlot[dwd], WaveletListPlot[dwd, Automatic, Re]}Options (37)
AspectRatio (1)
By default, the ratio of the height to width for the plot is determined automatically:
dwd = StationaryWaveletTransform[Sin[Range[50]^2 / 100], Automatic, 3];WaveletListPlot[dwd]Make the height the same as the width with AspectRatio1:
WaveletListPlot[dwd, AspectRatio -> 1]Use numerical value to specify the height-to-width ratio:
WaveletListPlot[dwd, AspectRatio -> 1 / GoldenRatio]AspectRatioFull adjusts the height and width to tightly fit inside other constructs:
plot = WaveletListPlot[dwd, AspectRatio -> Full];{Framed[Pane[plot, {50, 100}]], Framed[Pane[plot, {100, 100}]], Framed[Pane[plot, {100, 50}]]}Axes (3)
By default, Axes are drawn:
WaveletListPlot[StationaryWaveletTransform[Sin[Range[50]^2 / 100], Automatic, 3]]Use AxesFalse to turn off axes:
WaveletListPlot[StationaryWaveletTransform[Sin[Range[50]^2 / 100], Automatic, 3], Axes -> False]Turn each axis on individually:
{WaveletListPlot[StationaryWaveletTransform[Sin[Range[50]^2 / 100], Automatic, 3], Axes -> {True, False}], WaveletListPlot[StationaryWaveletTransform[Sin[Range[50]^2 / 100], Automatic, 3], Axes -> {False, True}]}AxesLabel (3)
No axes labels are drawn by default:
WaveletListPlot[StationaryWaveletTransform[Sin[Range[50]^2 / 100], Automatic, 3]]WaveletListPlot[StationaryWaveletTransform[Sin[Range[50]^2 / 100], Automatic, 3], AxesLabel -> y]WaveletListPlot[StationaryWaveletTransform[Sin[Range[50]^2 / 100], Automatic, 3], AxesLabel -> {label1, label2}]AxesOrigin (3)
The position of the axes is determined automatically:
WaveletListPlot[StationaryWaveletTransform[Sin[Range[50]^2 / 100], Automatic, 3]]Specify an explicit origin for the axes:
WaveletListPlot[StationaryWaveletTransform[Sin[Range[50]^2 / 100], Automatic, 3], AxesOrigin -> {30, 0}]The AxesOrigin option has special settings depending on the setting for PlotLayout:
data = Table[2 - 5 t + 5 Exp[-500 (t - 0.5) ^ 2], {t, 0, 1, 0.05}];dwd = DiscreteWaveletTransform[data, Automatic, 3];With "CommonXAxis", AxesOrigin{…,n} aligns the horizontal axis with the n![]() plot:
plot:
Table[WaveletListPlot[dwd, PlotLayout -> "CommonXAxis", Ticks -> Full, AxesOrigin -> {Automatic, n}, PlotLabel -> AxesOrigin -> {Automatic, n}], {n, {0, 1, 3, 5}}]With "CommonYAxis", AxesOrigin{n,…} places the vertical axis after the n![]() plot:
plot:
Table[WaveletListPlot[dwd, PlotLayout -> "CommonYAxis", Ticks -> Full, AxesOrigin -> {n, Automatic}, PlotLabel -> AxesOrigin -> {n, Automatic}], {n, {0, 1, 3, 4}}]AxesStyle (4)
Change the style for the axes:
WaveletListPlot[StationaryWaveletTransform[Sin[Range[50]^2 / 100], Automatic, 3], AxesStyle -> Red]Specify the style of each axis:
WaveletListPlot[StationaryWaveletTransform[Sin[Range[50]^2 / 100], Automatic, 3], AxesStyle -> {{Thick, Red}, {Thick, Blue}}]Use different styles for the ticks and the axes:
WaveletListPlot[StationaryWaveletTransform[Sin[Range[50]^2 / 100], Automatic, 3], AxesStyle -> Green, TicksStyle -> Red]Use different styles for the labels and the axes:
WaveletListPlot[StationaryWaveletTransform[Sin[Range[50]^2 / 100], Automatic, 3], AxesStyle -> Green, LabelStyle -> Red]DataRange (1)
Plot coefficients assuming the original data occupies the actual coordinate range {0,1}:
data = Table[2 - 5 t + 5 Exp[-500 (t - 0.5) ^ 2], {t, 0, 1, 0.05}];dwd = DiscreteWaveletTransform[data];WaveletListPlot[dwd, DataRange -> {0, 1}]Filling (1)
data = Table[2 - 5 t + 5 Exp[-500 (t - 0.5) ^ 2], {t, 0, 1, 0.05}];dwd = DiscreteWaveletTransform[data];WaveletListPlot[dwd, Filling -> Axis]Plot against common vertical axis with filling:
WaveletListPlot[dwd, PlotLayout -> "CommonYAxis", Filling -> Axis]Frame (1)
FrameTicks (1)
By default, coefficients are labeled with their refinement level:
data = Table[2 - 5 t + 5 Exp[-500 (t - 0.5) ^ 2], {t, 0, 1, 0.05}];dwd = DiscreteWaveletTransform[data];WaveletListPlot[dwd, Frame -> True, FrameTicks -> Automatic]Label with the full wavelet index:
WaveletListPlot[dwd, Frame -> True, FrameTicks -> Full]Plot coefficients against a common vertical axis, labeling with the full wavelet index:
WaveletListPlot[dwd, PlotLayout -> "CommonYAxis", Frame -> True, FrameTicks -> Full]GridLines (1)
ImageSize (7)
Use named sizes such as Tiny, Small, Medium and Large:
{WaveletListPlot[StationaryWaveletTransform[Sin[Range[50]^2 / 100], Automatic, 3], ImageSize -> Tiny], WaveletListPlot[StationaryWaveletTransform[Sin[Range[50]^2 / 100], Automatic, 3], ImageSize -> Small]}Specify the width of the plot:
{WaveletListPlot[StationaryWaveletTransform[Sin[Range[50]^2 / 100], Automatic, 3], ImageSize -> 150], WaveletListPlot[StationaryWaveletTransform[Sin[Range[50]^2 / 100], Automatic, 3], AspectRatio -> 1.5, ImageSize -> 150]}Specify the height of the plot:
{WaveletListPlot[StationaryWaveletTransform[Sin[Range[50]^2 / 100], Automatic, 3], ImageSize -> {Automatic, 150}], WaveletListPlot[StationaryWaveletTransform[Sin[Range[50]^2 / 100], Automatic, 3], AspectRatio -> 2, ImageSize -> {Automatic, 150}]}Allow the width and height to be up to a certain size:
{WaveletListPlot[StationaryWaveletTransform[Sin[Range[50]^2 / 100], Automatic, 3], ImageSize -> UpTo[200]], WaveletListPlot[StationaryWaveletTransform[Sin[Range[50]^2 / 100], Automatic, 3], AspectRatio -> 2, ImageSize -> UpTo[200]]}Specify the width and height for a graphic, padding with space if necessary:
WaveletListPlot[StationaryWaveletTransform[Sin[Range[50]^2 / 100], Automatic, 3], ImageSize -> {200, 200}, Background -> StandardBrown]Setting AspectRatioFull will fill the available space:
WaveletListPlot[StationaryWaveletTransform[Sin[Range[50]^2 / 100], Automatic, 3], AspectRatio -> Full, ImageSize -> {200, 200}, Background -> StandardBrown]Use maximum sizes for the width and height:
{WaveletListPlot[StationaryWaveletTransform[Sin[Range[50]^2 / 100], Automatic, 3], ImageSize -> {UpTo[150], UpTo[100]}], WaveletListPlot[StationaryWaveletTransform[Sin[Range[50]^2 / 100], Automatic, 3], AspectRatio -> 1, ImageSize -> {UpTo[150], UpTo[100]}]}Use ImageSizeFull to fill the available space in an object:
Framed[Pane[WaveletListPlot[StationaryWaveletTransform[Sin[Range[50]^2 / 100], Automatic, 3], ImageSize -> Full, Background -> StandardBrown], {200, 100}]]Specify the image size as a fraction of the available space:
Framed[Pane[WaveletListPlot[StationaryWaveletTransform[Sin[Range[50]^2 / 100], Automatic, 3], AspectRatio -> Full, ImageSize -> {Scaled[0.5], Scaled[0.5]}, Background -> StandardBrown], {200, 200}]]Joined (1)
Plot points are joined by default:
data = Table[2 - 5 t + 5 Exp[-500 (t - 0.5) ^ 2], {t, 0, 1, 0.01}];dwd = DiscreteWaveletTransform[data, Automatic, 2];WaveletListPlot[dwd]WaveletListPlot[dwd, Joined -> False]Method (5)
Inverse transform each coefficient before plotting:
dwd = StationaryWaveletTransform[Sin[Range[50]^2 / 100]];WaveletListPlot[dwd, PlotLayout -> "CommonYAxis", Method -> "InverseTransform"]Control style of interior axes:
dwd = StationaryWaveletTransform[Sin[Range[50]^2 / 100]];WaveletListPlot[dwd, PlotLayout -> "CommonYAxis", Method -> {"InteriorAxesStyle" -> Directive[Opacity[0.3], Blue]}]dwd = StationaryWaveletTransform[Sin[Range[50]^2 / 100]];WaveletListPlot[dwd, Method -> {"InteriorAxes" -> None}]Choose which channel to plot in multichannel sound data:
dwd = DiscreteWaveletTransform[Sound[«1»]];Table[WaveletListPlot[dwd, {{1}, {0, 1}, {0, 0, 1}}, PlotLayout -> "CommonYAxis", Method -> m, PlotLabel -> m], {m, {"DataChannel" -> 1, "DataChannel" -> 2}}]Include original data (wavelet index {}) in plot:
dwd = StationaryWaveletTransform[Sin[Range[50]^2 / 100], Automatic, 3];Table[WaveletListPlot[dwd, Ticks -> Full, Method -> m, PlotLabel -> m], {m, {"PlotData" -> True, "PlotData" -> False}}]PlotLayout (1)
Plot coefficients over a common horizontal axis (default):
data = Table[2 - 5 t + 5 Exp[-500 (t - 0.5) ^ 2], {t, 0, 1, 0.05}];dwd = DiscreteWaveletTransform[data];WaveletListPlot[dwd, PlotLayout -> "CommonXAxis"]Plot against a common vertical axis:
WaveletListPlot[dwd, PlotLayout -> "CommonYAxis"]PlotRange (1)
PlotStyle (1)
Specify an overall style for each wavelet coefficient:
data = Table[2 - 5 t + 5 Exp[-500 (t - 0.5) ^ 2], {t, 0, 1, 0.05}];dwd = DiscreteWaveletTransform[data];WaveletListPlot[dwd, PlotStyle -> {Red, Blue, Transparent, Dashed, Green}]Specify a single style for the whole plot:
WaveletListPlot[dwd, PlotStyle -> Thick]PlotTheme (1)
Use a theme with grid lines in a bright color scheme:
dwd = StationaryWaveletTransform[Sin[Range[50]^2 / 100], Automatic, 3];WaveletListPlot[dwd, PlotTheme -> "Business"]Add a feature theme with frame and full grid lines:
dwd = StationaryWaveletTransform[Sin[Range[50]^2 / 100], Automatic, 3];WaveletListPlot[dwd, PlotTheme -> {"Business", "FrameGrid"}]WaveletListPlot[dwd, PlotTheme -> {"Business", "FrameGrid"}, PlotStyle -> 96]Ticks (1)
By default, coefficients are labeled with their refinement level:
data = Table[2 - 5 t + 5 Exp[-500 (t - 0.5) ^ 2], {t, 0, 1, 0.05}];dwd = DiscreteWaveletTransform[data];WaveletListPlot[dwd, Ticks -> Automatic]Label with the full wavelet index on vertical axis:
WaveletListPlot[dwd, Ticks -> Full]Plot coefficients against a common vertical axis, labeling with the full wavelet index:
WaveletListPlot[dwd, PlotLayout -> "CommonYAxis", Ticks -> Full]Applications (4)
Feature Detection (4)
Use PlotLayout->"CommonXAxis" to identify structure, such as edges in coefficients:
data = Table[Boole[30 ≤ x ≤ 70], {x, 100}];ListLinePlot[data]Detail coefficients {…,1} are sensitive to edges:
dwd = DiscreteWaveletTransform[data, DaubechiesWavelet[], 4];WaveletListPlot[dwd, Ticks -> Full, PlotLayout -> "CommonXAxis"]Use PlotLayout->"CommonYAxis" to compare scale of coefficients:
data = Table[(-1)^n + 1 + 2, {n, 100}];ListLinePlot[data, PlotRange -> {0, 3}]Compare scale of constant and oscillatory parts:
dwd = StationaryWaveletTransform[data, DaubechiesWavelet[2], 3];WaveletListPlot[dwd, Ticks -> Full, PlotLayout -> "CommonYAxis", Filling -> 0]Identify changing relative scale of coefficients:
data = Table[n^4(-1)^100n + Sqrt[1 - n], {n, 0, 1, 0.01}];ListLinePlot[data]Constant coefficient {…,0} dominates early and first detail coefficient {1} dominates later:
dwd = DiscreteWaveletTransform[data, DaubechiesWavelet[2], 3, Padding -> 0];WaveletListPlot[dwd, Ticks -> Full, PlotLayout -> "CommonYAxis", Filling -> Axis]Compare clean data with data plus noise with a nonzero mean:
data = Table[Sin[10x + x^2], {x, 0, 3, 0.1}];noise = RandomReal[1, Length[data]];Plot multiple sets of coefficients on the same WaveletListPlot:
dwd1 = DiscreteWaveletTransform[data, Automatic, 3];dwd2 = DiscreteWaveletTransform[data + noise, Automatic, 3];WaveletListPlot[{dwd1, dwd2}, Filling -> {1 -> {2}}]Highpass coefficients {…,1} are nearly the same, while lowpass coefficient {…,0} is different:
WaveletListPlot[{dwd1, dwd2}, PlotLayout -> "CommonYAxis", Filling -> {1 -> {2}}, Ticks -> Full]Properties & Relations (5)
WaveletListPlot plots vector wavelet coefficients with a common horizontal or vertical axis:
data = Table[2 - 5 t + 5 Exp[-500 (t - 0.5) ^ 2], {t, 0, 1, 0.02}];dwd = DiscreteWaveletTransform[data, Automatic, 3];{WaveletListPlot[dwd], WaveletListPlot[dwd, PlotLayout -> "CommonYAxis"]}dwd[…,"ListPlot"] gives each coefficient as a separate list plot:
dwd[Automatic, {"ListPlot"}]By default, WaveletListPlot shows the Automatic coefficients used in the inverse transform:
dwd = DiscreteWaveletPacketTransform[Sin[RandomReal[1, 32]], Automatic, 3];First /@ dwd[Automatic]WaveletListPlot[dwd, Ticks -> Full]WaveletBestBasis selects a different default tree of coefficients:
best = WaveletBestBasis[dwd];First /@ best[Automatic]WaveletListPlot[best, Ticks -> Full]WaveletScalogram plots vector coefficients with numerical magnitude indicated by color:
data = Table[2 - 5 t + 5 Exp[-500 (t - 0.5) ^ 2], {t, 0, 1, 0.02}];dwd = DiscreteWaveletTransform[data, Automatic, 3];WaveletScalogram[dwd]WaveletMatrixPlot plots matrix wavelet coefficients in a hierarchical grid:
data = RandomReal[1, {10, 10}];dwd = DiscreteWaveletTransform[data];WaveletMatrixPlot[dwd]WaveletImagePlot shows image wavelet coefficients in a hierarchical grid:
dwd = DiscreteWaveletTransform[[image]];WaveletImagePlot[dwd]Neat Examples (1)
Show stationary wavelet transform coefficients for data oscillating at different frequencies:
Animate[d = Cos[w Range[50]];ListLinePlot[d] -> WaveletListPlot[StationaryWaveletTransform[d, DaubechiesWavelet[], 3], PlotLayout -> "CommonYAxis", PlotRange -> 1, Filling -> Axis, AspectRatio -> 1 / GoldenRatio], {w, 0, π}]Text
Wolfram Research (2010), WaveletListPlot, Wolfram Language function, https://reference.wolfram.com/language/ref/WaveletListPlot.html (updated 2014).
CMS
Wolfram Language. 2010. "WaveletListPlot." Wolfram Language & System Documentation Center. Wolfram Research. Last Modified 2014. https://reference.wolfram.com/language/ref/WaveletListPlot.html.
APA
Wolfram Language. (2010). WaveletListPlot. Wolfram Language & System Documentation Center. Retrieved from https://reference.wolfram.com/language/ref/WaveletListPlot.html