

AggregateRows[tab,{key1f1,…}]
计算不同的汇总函数 fi[tab],将这些值赋给不同的键 keyi.
AggregateRows[tdata,fspec,gspec]
根据 gspec 给出的不同值形成组,然后用 fspec 对组中的值进行汇总.
AggregateRows[fspec]
表示有两个参数的 AggregateRows 的算符形式.
AggregateRows[fspec,gspec]
表示有三个参数的 AggregateRows 的算符形式.
AggregateRows
AggregateRows[tab,{key1f1,…}]
计算不同的汇总函数 fi[tab],将这些值赋给不同的键 keyi.
AggregateRows[tdata,fspec,gspec]
根据 gspec 给出的不同值形成组,然后用 fspec 对组中的值进行汇总.
AggregateRows[fspec]
表示有两个参数的 AggregateRows 的算符形式.
AggregateRows[fspec,gspec]
表示有三个参数的 AggregateRows 的算符形式.
更多信息
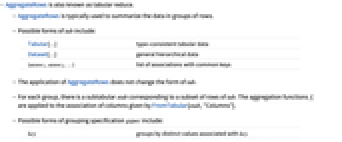
- AggregateRows 亦称为表格化简.
- AggregateRows 通常用于汇总各行数据.
- tab 可取的形式包括:
-
Tabular[…] 类型一致的表格数据 Dataset[…] 普通分层数据 {assoc1,assoc2,…} 含有公共键的关联列表 - 应用 AggregateRows 不改变 tab 的形式.
- 每组都有一个与 tab 行子集相对应的子表格 stab. 汇总函数 fi 适用于 FromTabular[stab,"Columns"] 给出的列关联.
- 分组指定 gspec 可采用的形式包括:
-
key 按与 key 关联的不同的值进分组 newkeyg 按 g[rowi] 的不同的值进分组,并将其添加为 newkey {spec1,…} 按所有 speci 的不同值进行分组
范例
打开所有单元 关闭所有单元基本范例 (2)
取一个 Tabular 对象:
tab = Tabular[{{"a", 1}, {"b", 2}, {"a", 3}, {"b", 4}}, {"col1", "col2"}]通过计算列 "col2" 的值的总和来汇总所有行 "col1":
AggregateRows[tab, {"j" -> (StringJoin[#col1]&), "t" -> (Total[#col2]&)}]AggregateRows[tab, "total" -> Function[Total[#col2]], "col1"]使用算符形式,通过计算键 "a" 的值的函数来汇总关联列表:
assocs = {<|"a" -> x, "b" -> 1|>, <|"a" -> y, "b" -> 2|>, <|"a" -> x, "b" -> 1|>};AggregateRows["c" -> Function[f[#a]]][assocs]AggregateRows["c" -> Function[f[#a]], "b"][assocs]范围 (8)
输入数据 (3)
汇总 Tabular 对象的所有行:
AggregateRows[Tabular[Association["RawSchema" -> Association["ColumnProperties" ->
Association["b" -> Association["ElementType" -> "Integer64"],
"c" -> Association["ElementType" -> "Integer64"],
"date" -> Association["ElementType" -> TypeSpecifier["Date"]["Integer64", "Day", "Gregorian",
None]]], "KeyColumns" -> None, "Backend" -> "WolframKernel"], "Options" -> {},
"BackendData" -> Association["ColumnData" -> DataStructure["ColumnTable",
{{TabularColumn[Association["Data" -> {{4, 4, 4}, {}, None}, "ElementType" -> "Integer64"]],
TabularColumn[Association["Data" -> {{1, 3, 5}, {}, None}, "ElementType" -> "Integer64"]],
TabularColumn[Association["Data" -> {3, {{{1080777600000, 1112486400000, 1144195200000},
{}, None}}, None}, "ElementType" -> "Date"["Integer64", "Day", "Gregorian", None],
"CachedOriginalExpression" -> {DateObject[{2004, 4, 1}, "Day"], DateObject[{2005, 4, 3},
"Day"], DateObject[{2006, 4, 5}, "Day"]}]]}}]]]], "total" -> (Total[#b + #c]&)]汇总 Dataset 对象的所有行:
AggregateRows[Dataset[{Association["b" -> 4, "c" -> 1, "date" -> DateObject[{2004, 4, 1}, "Day"]],
Association["b" -> 4, "c" -> 3, "date" -> DateObject[{2005, 4, 3}, "Day"]],
Association["b" -> 4, "c" -> 5, "date" -> DateObject[{2006, 4, 5}, "Day"]]}], "total" -> (Total[#b + #c]&)]AggregateRows[{<|"b" -> 4, "c" -> 1|>, <|"b" -> 4, "c" -> 3|>, <|"b" -> 4, "c" -> 5|>}, "total" -> (Total[#b + #c]&)]汇总函数 (2)
取一个 Tabular 对象:
tab = Tabular[{{"a", 1}, {"b", 2}, {"a", 3}, {"b", 4}}, {"col1", "col2"}]汇总函数 f 会收到一个包含所有列的关联,每一列都是一个值列表:
AggregateRows[tab, "newcol" -> f]用含有命名 Slot 符号的纯函数提取列:
AggregateRows[tab, "newcol" -> (f[#col1] + g[#col2]&)]也可以用 Part 符号:
AggregateRows[tab, "newcol" -> (f[#[[1]]] + g[#[[2]]]&)]用一组汇总函数汇总 Tabular 对象:
tab = Tabular[{{4, 1, DateObject[{2004, 4, 1}, "Day"]}, {4, 3, DateObject[{2005, 4, 3}, "Day"]}, {4, 5, DateObject[{2006, 4, 5}, "Day"]}}, {"b", "c", "date"}]AggregateRows[tab, {"total b" -> (Total[#b]&), "max c" -> (Max[#c]&), "mean date" -> (Mean[#date]&)}]AggregateRows[tab, {"total b+c" -> (Total[#b + #c]&), "mean date" -> (Mean[#date]&)}]分组指定 (3)
tab = Tabular[{{"a", 1}, {"b", 2}, {"a", 3}, {"b", 4}}, {"col1", "col2"}]AggregateRows[tab, "newcol" -> (Mean[#col2]&), "col1"]根据函数 g 的计算结果分组,结果相同的分在一组,然后求平均值:
tab = Tabular[{{"a", 1}, {"b", 2}, {"a", 3}, {"b", 2}}, {"col1", "col2"}]AggregateRows[tab, "newcol" -> (Mean[#col2]&), "group" -> g]AggregateRows[tab, "newcol" -> (Mean[#col2]&), "group" -> (g[#col1]&)]取一个 Tabular 对象:
tab = Tabular[{{4, 1, DateObject[{2004, 4, 1}, "Day"]}, {2, 3, DateObject[{2005, 4, 3}, "Day"]}, {6, 5, DateObject[{2006, 1, 5}, "Day"]}, {2, 3, DateObject[{2004, 1, 20}, "Day"]}, {4, 1, DateObject[{2005, 12, 12}, "Day"]}}, {"b", "c", "date"}]首先将键 "b" 和 "c" 的值相同的关联分组,然后分别汇总:
AggregateRows[tab, "newcol" -> (Mean[#date]&), {"b", "c"}]AggregateRows[tab, "newcol" -> (Mean[#date]&), {"b+c" -> (Total[#b + #c]&), "c"}]应用 (6)
取一个 Tabular 对象,其中含有测量的 0、30 和 80 米三个深度的土壤的 pH 值:
Tabular[{...}]AggregateRows[%, "mean" -> (Mean[#pH]&), "depth"]tab = ResourceData["Sample Tabular Data: Fisher Iris"]AggregateRows[tab, "SepalLengthMean" -> (Mean[#[[2]]]&)]AggregateRows[tab, "PetalLengthMean" -> Function[Median[#PetalLength]]]AggregateRows[tab, "species" -> Function[Length[#Species]], "Species"]AggregateRows[tab, "mean" -> Function[Mean[#SepalLength]], "Species"]老忠实间歇泉数据包含喷发时间和下次喷发的等待时间(以分钟为单位):
name = {"Statistics", "OldFaithful"};tab = Tabular[ExampleData[name], ExampleData[name, "ColumnHeadings"]]AggregateRows[tab, "corr" -> Function[Correlation[#Duration, #WaitingTime]]]ListPlot[tab//Normal, AxesLabel -> Automatic]AggregateRows[tab, "MeanDuration" -> Function[Mean[#Duration]], "WT ≥ 50" -> Function[#WaitingTime >= 50]]转换为 Tabular 对象的普通形式:
%//Normaltab = ResourceData["Sample Tabular Data: Palmer Penguins"]ColumnKeys[tab]AggregateRows[tab, "body_mass_mean" -> Function[Mean[#"body_mass"]], "sex"]AggregateRows[tab, "body_mass_median" -> Function[Median[#"body_mass"]], "island"]AggregateRows[tab, "distribution" -> (EstimatedDistribution[#"body_mass", NormalDistribution[a, b]]&), "species"]绘制每个估计分布的 PDF 图:
Plot[Evaluate[PDF[#, Quantity[x, "Grams"]]& /@ %[All, "distribution"]], {x, 2000, 7000}, PlotLegends -> Normal[%[All, "species"]]]以下是包含洛杉矶每月臭氧读数数据的 Tabular 对象:
data = ResourceData["Sample Tabular Data: Los Angeles Ozone"]rules = Map[With[{name = #}, name -> Function[Mean[#[name]]]]&, Rest[ColumnKeys[data]]];means = AggregateRows[data, rules]PieChart[Normal[means[1]], ChartLabels -> ColumnKeys[means], ColorFunction -> "RedBlueTones"]以下是包含一组车型数据的 Tabular 对象:
data = ResourceData["Sample Tabular Data: Fuel Economy"]AggregateRows[data, { "city_mean" -> Function[Mean[#"city"]], "hwy_mean" -> Function[Mean[#"hwy"]]}, {"drive", "year"}]求 2008 年每个制造商生产的车的平均城市和高速公路里程数:
means = AggregateRows[Select[data, #year == 2008&], { "city_mean" -> Function[Mean[#"city"]], "hwy_mean" -> Function[Mean[#"hwy"]]}, "manufacturer"]PairedBarChart[{means -> "city_mean"}, {means -> "hwy_mean"}, BarSpacing -> {22, 0, .2}, ColorFunction -> "RedGreenSplit", ChartLabels -> {Placed[{"city mpg", "highway mpg"}, Above], None, Normal[means[All, "manufacturer"]]}]可能存在的问题 (1)
在不分组的情况下使用 AggregateRows 可能会将 Tabular 对象过度精简:
tab = ResourceData["Sample Tabular Data: Fisher Iris"]AggregateRows[tab, "counts" -> Function[Tally[#Species]]]AggregateRows[tab, "count" -> Function[Length[#Species]], "Species"]文本
Wolfram Research (2025),AggregateRows,Wolfram 语言函数,https://reference.wolfram.com/language/ref/AggregateRows.html.
CMS
Wolfram 语言. 2025. "AggregateRows." Wolfram 语言与系统参考资料中心. Wolfram Research. https://reference.wolfram.com/language/ref/AggregateRows.html.
APA
Wolfram 语言. (2025). AggregateRows. Wolfram 语言与系统参考资料中心. 追溯自 https://reference.wolfram.com/language/ref/AggregateRows.html 年
BibTeX
@misc{reference.wolfram_2026_aggregaterows, author="Wolfram Research", title="{AggregateRows}", year="2025", howpublished="\url{https://reference.wolfram.com/language/ref/AggregateRows.html}", note=[Accessed: 07-August-2026]}
BibLaTeX
@online{reference.wolfram_2026_aggregaterows, organization={Wolfram Research}, title={AggregateRows}, year={2025}, url={https://reference.wolfram.com/language/ref/AggregateRows.html}, note=[Accessed: 07-August-2026]}