

Arrow
詳細
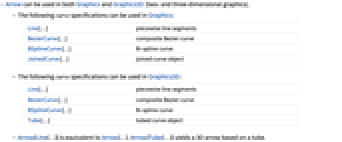
- ArrowはGraphicsおよびGraphics3Dの両方(すなわち二次元および三次元のグラフィックス)で用いることができる.
- Graphicsでは次の curve 指定を使うことができる.
-
Line[…] 区分線分 BezierCurve[…] 合成ベジエ(Bezier)曲線 BSplineCurve[…] Bスプライン曲線 JoinedCurve[…] 連結曲線オブジェクト - Graphics3Dでは次の curve 指定を使うことができる.
-
Line[…] 区分線分 BezierCurve[…] 合成ベジエ曲線 BSplineCurve[…] Bスプライン曲線 Tube[…] 管の曲線オブジェクト - Arrow[Line[…]]はArrow[…]に等しい.Arrow[Tube[…]]は管に基づいた3Dの矢印を与える.
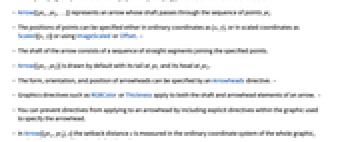
- Arrow[{pt1,pt2,…}]は矢柄が連続する点 ptiを通る矢印を表す.
- 点の位置は{x,y}のような通常の座標やScaled[{x,y}]のようなスケールされた座標を使って指定できる.ImageScaledやOffsetを使って指定することもできる. »
- 矢印の矢柄は指定の点を繋ぐまっすぐな部分の連続からなっている.
- Arrow[{pt1,pt2}]は,デフォルトで矢柄の先端が pt1に,鏃の先端が pt2になるように描かれる.
- 鏃の形,方向それに位置はArrowheads指示子で指定できる. »
- RGBColorやThicknessのようなグラフィックス指示子は矢柄と鏃の両方の要素に適用される. »
- 指示子が鏃に適用されないようにしたければ,使用するグラフィックスに明示的に指示子を入れて鏃を指定することができる.
- Arrow[{pt1,pt2},s]では,後退距離 s はグラフィックス全体の通常の座標で測られる.このため,矢印はDisk[pti,s]に若干触れる. »
- グラフィックスが全体としてAspectRatio->Automaticではないとき,指定された矢印の後退距離はグラフィックスの方向によって異なることがある.
例題
すべて開く すべて閉じる例 (6)
Graphics[Arrow[{{1, 0}, {2, 1}, {3, 0}, {4, 1}}]]Graphics3D[Arrow[{{1, 1, -1}, {2, 2, 0}, {3, 3, -1}, {4, 4, 0}}]]Graphics3D[{Red, Arrowheads[0.1], Arrow[Tube[{{1, 1, -1}, {2, 2, 0}, {3, 3, -1}, {4, 4, 0}}, 0.05]]}]{Graphics[{Arrow[BezierCurve[{{0, 0}, {1, 1}, {2, -1}}]]}], Graphics3D[{Arrow[BSplineCurve[{{0, 0, 0}, {1, 1, 1}, {2, -1, 1}, {3, 0, 2}}]]}]}{Graphics[{Arrowheads[{-.1, .1}], Arrow[{{0, 0}, {1, 1 / 3}}]}], Graphics3D[{Arrowheads[{-.1, .1}], Arrow[{{0, 0, 0}, {2, 1, 1}}]}], Graphics3D[{Arrowheads[{-.1, .1}], Arrow[Tube[{{0, 0, 0}, {2, 1, 1}}]]}]}a = {Arrowheads[Large], Arrow[{{0, 0}, {1, .5}}]};{Graphics[{Dashed, a}], Graphics[{Red, a}], Graphics[{Thick, a}], Graphics[{Thick, Dashed, Red, a}]}スコープ (17)
矢印の指定 (7)
Graphics[Arrow[{{0, 0}, {2, 1}}]]Graphics[Arrow[{{0, 0}, {2, 1}, {4, 0}}]]{Graphics[Arrow[Line[{{0, 0}, {2, 1}}]]], Graphics3D[Arrow[Line[{{0, 0, 0}, {2, 1, 1}}]]], Graphics3D[Arrow[Tube[{{0, 0, 0}, {2, 1, 1}}]]]}{Graphics[Arrow[BezierCurve[{{0, 0}, {1, 2}, {4, 2}}]]], Graphics3D[Arrow[BSplineCurve[{{0, 0, 0}, {1, 2, 2}, {4, 2, 2}}]]], Graphics3D[Arrow[Tube[BSplineCurve[{{0, 0, 0}, {1, 2, 2}, {4, 2, 2}}]]]]}s = {{0, 0}, {2, 1.5}, {4, 0}};{Graphics[Arrow[Line[{s, s + 1}]]], Graphics[Arrow[BezierCurve[{s, s + 1}]]]}{Graphics[{Arrow[{{0, 0}, {2, 1}}], Circle[{2, 1}, .3]}], Graphics[{Arrow[{{0, 0}, {2, 1}}, .3], Circle[{2, 1}, .3]}]}{Graphics[{Arrow[BSplineCurve[{{0, 0}, {1, -1}, {2, 1}}]], Circle[{2, 1}, .3]}], Graphics[{Arrow[BSplineCurve[{{0, 0}, {1, -1}, {2, 1}}], .3], Circle[{2, 1}, .3]}]}{Graphics3D[{Opacity[.8], Arrow[{{0, 0, 0}, {2, 1, 0}}], Sphere[{2, 1, 0}, .3]}], Graphics3D[{Opacity[.8], Arrow[{{0, 0, 0}, {2, 1, 0}}, .3], Sphere[{2, 1, 0}, .3]}]}矢印のスタイル (7)
Table[Graphics[{Thickness[i], Arrow[{{0, 0}, {2, 1}}]}], {i, {Tiny, Small, Medium, Large}}]Table[Graphics3D[{Thickness[i], Arrow[{{0, 0, 0}, {2, 1, 1}}]}], {i, {Tiny, Small, Medium, Large}}]{Graphics[{Dashed, Arrow[{{0, 0}, {2, 1}}]}], Graphics[{Dotted, Arrow[{{0, 0}, {2, 1}}]}], Graphics[{DotDashed, Arrow[{{0, 0}, {2, 1}}]}]}{Graphics3D[{Dashed, Arrow[{{0, 0, 0}, {2, 1, 1}}]}], Graphics3D[{Dotted, Arrow[{{0, 0, 0}, {2, 1, 1}}]}], Graphics3D[{DotDashed, Arrow[{{0, 0, 0}, {2, 1, 1}}]}]}Table[Graphics[{c, Arrow[{{0, 0}, {2, 1}}]}], {c, {Red, Green, Blue}}]Table[Graphics3D[{c, Arrow[{{0, 0, 0}, {2, 1, 1}}]}], {c, {Red, Green, Blue}}]Table[Graphics[{Arrowheads[i], Arrow[{{0, 0}, {1, .5}}]}], {i, {Tiny, Small, Medium, Large}}]Table[Graphics[{Arrowheads[i], Arrow[BezierCurve[{{0, 0}, {1, -1}, {2, 1}}]]}], {i, {.1, .2, .3, .4}}]Table[Graphics3D[{Arrowheads[i], Arrow[{{0, 0, 0}, {2, 1, 1}}]}], {i, {Tiny, Small, Medium, Large}}]Table[Graphics3D[{Arrowheads[i], Arrow[Tube[{{0, 0, 0}, {2, 1, 1}}, 0.02]]}], {i, {Tiny, Small, Medium, Large}}]Graphicsを2Dと3Dの矢印の鏃に使うことができる:
h = Graphics[Line[{{-1, 1 / 2}, {0, 0}, {-1, -1 / 2}, {-1, 1 / 2}}]];{Graphics[{Arrowheads[{{-.1, 0, {h, 1}}, {.1, 1, {h, 1}}}], Arrow[{{0, 0}, {2, 1}}]}], Graphics[{Arrowheads[{{-.1, 0, {h, 1}}, {.1, 1, {h, 1}}}], Arrow[BezierCurve[{{0, 0}, {1, -1}, {2, 1}}]]}]}h = Graphics[{Green, Polygon[{{-1, 1 / 2}, {0, 0}, {-1, -1 / 2}, {-1, 1 / 2}}]}];Graphics3D[{Arrowheads[{{-.1, 0, {h, 1}}, {.1, 1, {h, 1}}}, Appearance -> "Projected"], Arrow[{{0, 0, 0}, {2, 1, 1}}]}]Graphics3Dを使って鏃を指定する:
h = Graphics3D[Line[{{-1, 1 / 2, 0}, {0, 0, 0}, {-1, -1 / 2, 0}, {-1, 1 / 2, 0}}]];{Graphics3D[{Arrowheads[{{-.1, 0, {h, 1}}, {.1, 1, {h, 1}}}], Arrow[{{0, 0, 0}, {2, 1, 1}}]}], Graphics3D[{Arrowheads[{{-.1, 0, {h, 1}}, {.1, 1, {h, 1}}}], Arrow[BSplineCurve[{{0, 0, 0}, {.5, 1, 1}, {2, 1, 1}}]]}]}座標指定 (3)
スケールされた(Scaled)座標を使う:
Graphics[Arrow[{Scaled[{0, .2}], Scaled[{1, .8}]}], Frame -> True]Graphics3D[{Arrow[{Scaled[{0, .2, 0}], Scaled[{1, .8, 0.8}]}]}, Axes -> True]Graphics3D[{Arrow[Tube[{Scaled[{0, .2, 0}], Scaled[{1, .8, 0.8}]}]]}, Axes -> True]画像がスケールされた(ImageScaled)座標を使う:
Graphics[Arrow[{ImageScaled[{0, .2}], ImageScaled[{1, .8}]}], Frame -> True]Offset座標を使う:
Graphics[Arrow[{Offset[{10, 20}, {0, 0}], Offset[{-10, -20}, {1, 1}]}], Frame -> True]アプリケーション (7)
Plot[Sin[x], {x, 0, 2Pi}, Epilog -> {Arrow[{{3Pi / 2, 1 / 2}, {Pi, 0}}], Text["Zero", {3Pi / 2, 1 / 2}, {-1, -1}]}]Show[Plot3D[Sin[x]Sin[y], {x, 0, 2Pi}, {y, 0, 2Pi}, Mesh -> None, PlotRange -> {-1, 4}, BoxRatios -> Automatic], Graphics3D[{Arrow[{{Pi, Pi, 4}, {Pi / 2, Pi / 2, 1}}], Arrow[{{Pi, Pi, 4}, {3Pi / 2, 3Pi / 2, 1}}], Text[Panel["Maximum", FrameMargins -> 0], {Pi, Pi, 4}]}]]With[{f = {v, u} / 5 - 1}, Graphics[Table[Arrow[{{u, v}, f + {u, v}}], {u, 0, 10}, {v, 0, 10}]]]With[{f = {v, u, 0} / 5 - 1}, Graphics3D[Table[Arrow[{{u, v, 0}, f + {u, v, 0}}], {u, 0, 10}, {v, 0, 10}]]]With[{f = {v, u, 0} / 5 - 1}, Graphics3D[Table[Arrow[Tube[{{u, v, 0}, f + {u, v, 0}}]], {u, 0, 10}, {v, 0, 10}]]]VectorPlotとVectorPlot3DはArrowを使う:
VectorPlot[{x, -y}, {x, -3, 3}, {y, -3, 3}, VectorColorFunction -> "Rainbow"]VectorPlot3D[{x, y - 2 x, z - x}, {x, -3, 3}, {y, -3, 3}, {z, -3, 3}, VectorColorFunction -> "Rainbow", VectorMarkers -> "Arrow"]GraphPlotのEdgeShapeFunctionとしてArrowを使う:
GraphPlot[Table[i -> Mod[i + 1, 6], {i, 0, 5}], EdgeShapeFunction -> (Arrow[#1]&), PlotStyle -> Arrowheads[Medium]]PolyhedronData["Dodecahedron", "Skeleton", "Rule"]GraphPlot3D[%, EdgeShapeFunction -> (Arrow[#1]&)]AnnotatedArrow[p_, q_, label_] := {Arrowheads[{{-.1, 0}, {.1, .5, Graphics[Inset[Style[label, Medium], {Center, Top}]]}, {.1, 1}}], Arrow[{p, q}]}Graphics[{AnnotatedArrow[{-1, 0}, {1, 0}, "diameter = 2"], Circle[]}]Graphics[{AnnotatedArrow[1 / Sqrt[2]{-1, -1}, 1 / Sqrt[2]{1, 1}, "*d* = 2"], Circle[]}]ParallelDim[p_, q_, offset_, label_] := {Arrowheads[{{-.1, 0}, {.1, 0, Graphics[Line[{{0, 1}, {0, -1}}]]}, {.1, .5, Graphics[Inset[Style[label, Medium], {Center, Top}]]}, {.1, 1, Graphics[Line[{{0, 1}, {0, -1}}]]}, {.1, 1}}], Arrow[{p + offset, q + offset}]}Graphics[{Thick, Line[{{0, 0}, {1, 1}, {1, 0}, {0, 0}}], Thin, ParallelDim[{0, 0}, {1, 1}, {-.1, .1}, Sqrt[2]]}]Graphics[{Arrowheads[{Table[{0.04, i}, {i, 0.04, 1, 0.05}], Table[{0.04, i}, {i, 0.04, 1, 0.2}]}], Arrow[JoinedCurve[{{Line[{{2, 3}, {0.8125, 0.625}}],
BezierCurve[{{0.6875, 0.375}, {0.375, 0.25}, {1.125, 0.25}}, SplineDegree -> 2], BezierCurve[{{0.8125, 0.375}, {0.9375, 0.625}}],
Line[{{1.3125, 1.375}, {2.4375, 1.375}, {2.8125, 0.625}}],
BezierCurve[{{2.9375, 0.375}, {2.625, 0.25}, {3.625, 0.25}}, SplineDegree -> 2], BezierCurve[{{3.3125, 0.375}, {3.1875, 0.625}}]},
{Line[{{1.875, 2.5}, {1.375, 1.5}, {2.375, 1.5}}]}}, CurveClosed -> True]]}]ListLinePlot[Table[{Sin[3t], Cos[5t]}, {t, 0, 2Pi, 2Pi / 50}], Axes -> False] /. Line[rest_] :> {Arrowheads[Table[0.05, {i, 0, 1, .02}]], Arrow[BSplineCurve@rest]}特性と関係 (1)
Arrowheadsを使って座標軸にスタイルを与える:
Plot[x ^ 3, {x, -1, 1}, AxesStyle -> Arrowheads[{-0.05, 0.05}]]おもしろい例題 (4)
Graphics[Table[{Hue[RandomReal[]], Arrow[RandomReal[1, {2, 2}]]}, {75}]]Graphics3D[Table[{Hue[RandomReal[]], Arrow[Tube[RandomReal[1, {2, 3}], Scaled[0.007]]]}, {50}]]Graphics[Table[{Hue[k / 40], Arrow[{{0, 0}, {Cos[2k Pi / 40], Sin[2k Pi / 40]}}]}, {k, 40}]]With[{f = {Cos[x] + Sin[x], Sin[x]}}, Graphics[Table[{Hue[t / (2Pi), 1, .8], Arrow[{f, Normalize[D[f, x]] + f}]} /. x -> t, {t, 0, 2Pi, .1}]]]tree = \!\(\*GraphicsBox[«2»]\);Graphics3D[{Arrowheads[{{.1, 1, tree}}, Appearance -> "Projected"], Arrow[{{0, 0, 0}, {0, -0, 0.001}}], Green, Cuboid[{-10, -10, -3}, {10, 10, -2.8}]}]関連項目
関連するガイド
-
▪
- グラフィックスオブジェクト ▪
- 地図と地図製作 ▪
- 矢印と矢印形式 ▪
- グラフィックスの結合 ▪
- 記号的なグラフィックス言語
テキスト
Wolfram Research (2007), Arrow, Wolfram言語関数, https://reference.wolfram.com/language/ref/Arrow.html (2010年に更新).
CMS
Wolfram Language. 2007. "Arrow." Wolfram Language & System Documentation Center. Wolfram Research. Last Modified 2010. https://reference.wolfram.com/language/ref/Arrow.html.
APA
Wolfram Language. (2007). Arrow. Wolfram Language & System Documentation Center. Retrieved from https://reference.wolfram.com/language/ref/Arrow.html
BibTeX
@misc{reference.wolfram_2026_arrow, author="Wolfram Research", title="{Arrow}", year="2010", howpublished="\url{https://reference.wolfram.com/language/ref/Arrow.html}", note=[Accessed: 17-August-2026]}
BibLaTeX
@online{reference.wolfram_2026_arrow, organization={Wolfram Research}, title={Arrow}, year={2010}, url={https://reference.wolfram.com/language/ref/Arrow.html}, note=[Accessed: 17-August-2026]}