



MandelbrotSetPlot
MandelbrotSetPlot[{zmin,zmax}]
マンデルブロ集合の,コーナーが zminおよび zmaxである長方形に入る部分をプロットする.
マンデルブロ集合をデフォルトの長方形内にプロットする.
詳細とオプション
- マンデルブロ集合は,
 から始めた場合に,数列
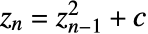 が無限大に発散しないすべての複素数 c の集合である.
- MandelbrotSetPlot[]のデフォルトの長方形のコーナーは,
 および
 である.
- MandelbrotSetPlotは,Rasterプリミティブを含むGraphicsオブジェクトを作る.
- MandelbrotSetPlot[]には,Graphicsと同じオプションに次を加えたものが使える.
-
ColorFunction Automatic 画素の色をどのように決定するか EscapeRadius 2 点が集合に含まれないと,どのように決定するか Frame True プロットの周りに枠を描くかどうか ImageResolution 500 大きい方の方向の画像の解像度 MaxIterations 1000 点ごとの最大反復回数 PerformanceGoal $PerformanceGoal パフォーマンスのどの面について最適化するか PlotLegends None 反復回数についての凡例 PlotTheme $PlotTheme プロットの全体的なテーマ - MaxIterations->n(n は正の整数)のとき,関数
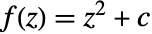 は,0の軌道が2を超えるかどうかを判断するために,最高で n 回反復される.
- ColorFunction->f(f は関数)のとき,f の引数は
 の形の反復回数に比例する実数であり,f はRGBColorあるいはHueのような色指示子,またはRedあるいはBlueのような名前付きの色を返さなければならない.
- ColorFunction->"name"はColorFunction->(If[#1,Black,ColorData["name"][#]]&)と等価である.
- 使用可能な色関数名のリストはColorData["Gradients"]で得ることができる.
例題
すべて開く すべて閉じる例 (3)
MandelbrotSetPlot[]MandelbrotSetPlot[{-0.65 + 0.47I, -0.4 + 0.72I}, MaxIterations -> 200, ColorFunction -> "RedBlueTones"]MandelbrotSetPlot[{-0.65 + 0.47I, -0.4 + 0.72I}, PlotLegends -> Automatic]オプション (59)
AspectRatio (4)
デフォルトで,MandelbrotSetPlotは幅と高さに同じサイズを使う:
MandelbrotSetPlot[]MandelbrotSetPlot[AspectRatio -> .5]AspectRatioAutomaticとすると,縦横比がプロット範囲から決定される:
MandelbrotSetPlot[AspectRatio -> Automatic]AspectRatioFullとすると,他の構造物内にぴったり納まるように高さと幅が調整される:
plot = MandelbrotSetPlot[AspectRatio -> Full];
{Framed[Pane[plot, {75, 100}]], Framed[Pane[plot, {100, 100}]], Framed[Pane[plot, {100, 75}]]}
Axes (3)
デフォルトで,MandelbrotSetPlotは軸ではなく枠を使う:
MandelbrotSetPlot[]MandelbrotSetPlot[Frame -> False, Axes -> True]{MandelbrotSetPlot[Frame -> False, Axes -> {True, False}], MandelbrotSetPlot[Frame -> False, Axes -> {False, True}]}AxesLabel (3)

AxesOrigin (2)
AxesStyle (4)
MandelbrotSetPlot[Frame -> False, Axes -> True, AxesStyle -> Red]MandelbrotSetPlot[Frame -> False, Axes -> True, AxesStyle -> {{Thick, Orange}, {Thick, Blue}}]MandelbrotSetPlot[Frame -> False, Axes -> True, AxesStyle -> Blue, TicksStyle -> Red]MandelbrotSetPlot[Frame -> False, Axes -> True, AxesStyle -> Blue, LabelStyle -> Red]ColorFunction (5)
スケールされた反復回数で色付けするために,組込みの色関数を使う:
MandelbrotSetPlot[ColorFunction -> Hue]MandelbrotSetPlot[ColorFunction -> (If[#3 == 1, Blue, GrayLevel[5#3]]&)]MandelbrotSetPlot[ColorFunction -> "GreenPinkTones"]MandelbrotSetPlot[{0.2 + 0.45I, 0.4 + 0.65I}, ColorFunction -> "GreenPinkTones"]MandelbrotSetPlot[ColorFunction -> (If[#1 == 1, Black, RGBColor[(1 - #3)^2, (1 - #3)^3, 1 - #3]]&)]MandelbrotSetPlot[MaxIterations -> 10, ColorFunction -> (If[#3 > 9 / 10, Black, Blue]&)]ColorFunctionScaling (2)
EscapeRadius (1)
Frame (3)
FrameLabel (4)
MandelbrotSetPlot[FrameLabel -> {"Real"}]MandelbrotSetPlot[FrameLabel -> {"Real", "Imaginary"}]MandelbrotSetPlot[FrameLabel -> {{"left", "right"}, {"bottom", "top"}}]MandelbrotSetPlot[FrameLabel -> {{y, y2}, {x, x2}}, LabelStyle -> Directive[Bold, StandardGray]]FrameStyle (2)
FrameTicks (8)
MandelbrotSetPlot[FrameTicks -> None]MandelbrotSetPlot[FrameTicks -> {{None, None}, {Automatic, None}}]デフォルトで,上と右の辺には目盛は置かれるが目盛ラベルは置かれない:
MandelbrotSetPlot[FrameTicks -> Automatic]Allを使ってすべての辺に目盛ラベルを含める:
MandelbrotSetPlot[FrameTicks -> All]MandelbrotSetPlot[FrameTicks -> {{{.1, .5, 1}, {.1, .5, 1}}, {{-.5, 0, .5}, {-.5, 0, .5}}}]MandelbrotSetPlot[FrameTicks -> {{{{.1, a}, {.5, b}, {1, c}}, {.1, .5, 1}}, {{{-.5, c}, {0, d}, {.5, e} }, {-.5, 0, .5 }}}]MandelbrotSetPlot[FrameTicks -> {{Automatic, {{.1, a, .12}, {.5, b, .1}, {1, c, .25}}}, {Automatic, Automatic}}]MandelbrotSetPlot[Axes -> False, FrameTicks -> {{Automatic, {{.1, a, {.12, .05}}, {.5, b, {.1, .1}}, {1, c, {.25, .2}}}}, {Automatic, Automatic}}]MandelbrotSetPlot[FrameTicks -> {{Automatic, {{.1, a, {.12, .05}, Directive[Blue, Thick, Dashed]}, {.5, b, {.1, .1}}, {1, c, {.25, .2}, Directive[Thick, Green]}}}, {Automatic, Automatic}}]minMeanMax[min_, max_] := {{min, min}, {(max + min) / 2, (max + min) / 2}, {max, max}}MandelbrotSetPlot[FrameTicks -> {{minMeanMax, None}, {minMeanMax, None}}, PlotRangePadding -> None]ImageResolution (1)
より細かいプロットにするためにImageResolutionを上げる:
Table[MandelbrotSetPlot[ImageResolution -> ir], {ir, 50, 300, 50}]ImageSize (7)
Tiny,Small,Medium,Largeのような名前付きのサイズを使う:
{MandelbrotSetPlot[ImageSize -> Tiny], MandelbrotSetPlot[ImageSize -> Small]}{MandelbrotSetPlot[ImageSize -> 150], MandelbrotSetPlot[AspectRatio -> 1.5, ImageSize -> 150]}{MandelbrotSetPlot[ImageSize -> {Automatic, 150}], MandelbrotSetPlot[AspectRatio -> 2, ImageSize -> {Automatic, 150}]}{MandelbrotSetPlot[ImageSize -> UpTo[200]], MandelbrotSetPlot[AspectRatio -> 2, ImageSize -> UpTo[200]]}グラフィックスの幅と高さを指定して,必要な場合はスペースで充填する:
MandelbrotSetPlot[ImageSize -> {200, 250}, Background -> Lighter@Orange]AspectRatioFullと設定すると,使用可能なスペースが塗り潰される:
MandelbrotSetPlot[AspectRatio -> Full, ImageSize -> {200, 250}, Background -> Lighter@Orange]{MandelbrotSetPlot[ImageSize -> {UpTo[150], UpTo[100]}], MandelbrotSetPlot[AspectRatio -> 2, ImageSize -> {UpTo[150], UpTo[100]}]}ImageSizeFullを使ってオブジェクト内の使用可能なスペースを塗り潰す:
Framed[Pane[MandelbrotSetPlot[ImageSize -> Full, Background -> Lighter@Orange], {200, 200}]]Framed[Pane[MandelbrotSetPlot[AspectRatio -> Full, ImageSize -> {Scaled[0.5], Scaled[0.5]}, Background -> Lighter@Orange], {200, 100}]]MaxIterations (1)
MaxIterationsを大きくして拡大したときの質を向上させる:
{MandelbrotSetPlot[{-0.743 + 0.175I, -0.723 + 0.195I}], MandelbrotSetPlot[{-0.743 + 0.175I, -0.723 + 0.195I},
	MaxIterations -> 800]}
PlotTheme (1)
Ticks (4)
MandelbrotSetPlot[{.25, .5 + .25 I}, MaxIterations -> 50, Frame -> False, Axes -> True]MandelbrotSetPlot[{.25, .5 + .25 I}, MaxIterations -> 50, Frame -> False, Axes -> True, Ticks -> None]MandelbrotSetPlot[{.25, .5 + .25 I}, MaxIterations -> 50, Frame -> False, Axes -> True, Ticks -> {{.3, .4, .45}, {.05, .1, .2}}]MandelbrotSetPlot[{.25, .5 + .25 I}, MaxIterations -> 50, Frame -> False, Axes -> True, Ticks -> {{{.3, a}, {.4, b}, {.45, c}}, {{.05, d}, {.1, e}, {.2, f}}}]TicksStyle (4)
MandelbrotSetPlot[{.25, .5 + .25 I}, MaxIterations -> 50, Frame -> False, Axes -> True, TicksStyle -> Directive[Blue, 14]]MandelbrotSetPlot[{.25, .5 + .25 I}, MaxIterations -> 50, Frame -> False, Axes -> True, TicksStyle -> {Directive[Red, 15], Directive[Blue, 15]}]MandelbrotSetPlot[{.25, .5 + .25 I}, MaxIterations -> 50, Frame -> False, Axes -> True, TicksStyle -> Directive[Darker@Green, 15], Ticks -> {{{.3, a, .1}, {.4, b, .05}, {.45, c, .2}}, {{.05, d, .3}, {.1, e, .4}, {.2, f, .5}}}]MandelbrotSetPlot[{.25, .5 + .25 I}, MaxIterations -> 50, Frame -> False, Axes -> True, Ticks -> {{{.3, a, .1, Directive[Thick, White]}, {.4, b, .35, Directive[Thick, White]}, {.45, c, .7, Directive[Thick, White]}}, {{.05, d, .3, Directive[Thick, White]}, {.1, e, .4, Directive[Thick, White]}, {.2, f, .5, Directive[Thick, White]}}}]特性と関係 (3)
c = -0.123 + 0.745I;
{MandelbrotSetPlot[Epilog  -> {Red, PointSize[Medium], Point[{Re[c], Im[c]}]}],
JuliaSetPlot[c]}MandelbrotSetMemberQを使って,ある点がマンデルブロ集合に含まれるかどうかを調べる:
MandelbrotSetPlot[Epilog -> {Red, PointSize[Medium], Point[{-0.123, 0.745}]}]MandelbrotSetMemberQ[-0.123 + 0.745I]MandelbrotSetIterationCountは,点がマンデルブロ集合に含まれないかどうかを調べるために行った反復の回数を与える:
MandelbrotSetPlot[Epilog -> {Red, PointSize[Medium], Point[{-0.123, 0.945}]}]MandelbrotSetIterationCount[-0.123 + 0.945I, MaxIterations -> 100]テキスト
Wolfram Research (2014), MandelbrotSetPlot, Wolfram言語関数, https://reference.wolfram.com/language/ref/MandelbrotSetPlot.html.
CMS
Wolfram Language. 2014. "MandelbrotSetPlot." Wolfram Language & System Documentation Center. Wolfram Research. https://reference.wolfram.com/language/ref/MandelbrotSetPlot.html.
APA
Wolfram Language. (2014). MandelbrotSetPlot. Wolfram Language & System Documentation Center. Retrieved from https://reference.wolfram.com/language/ref/MandelbrotSetPlot.html