

TimeSeriesResample
TimeSeriesResample[tseries]
uniformly resamples the time series tseries according to its minimum time increment.
TimeSeriesResample[tseries,rspec]
resamples tseries according to the resampling specification rspec.
Details and Options
- TimeSeriesResample is typically used to convert an irregular time series to regular one so that algorithms for regular time series can be used, such as filtering operations. It can also be used to align several time series.
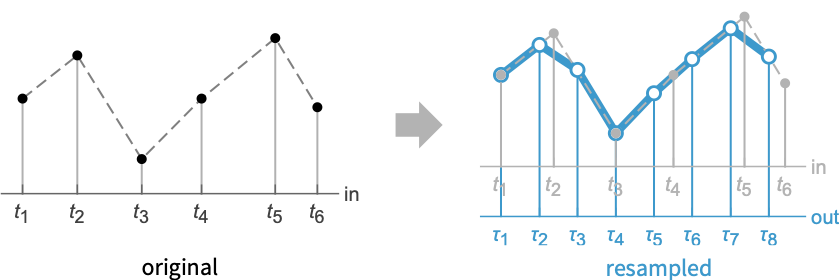
- Given a time series with timestamps
 , a resampled time series with timestamps
  can be generated with values tseries[τi].
 - Possible forms of time series tseries include:
-
TimeSeries[…] continuous time-ordered sampled data TemporalData[…] one or more paths composed of time-value pairs {{t1,x1},{t2,x2},…} list of time-value pairs {x1,x2,…} list of values with implied integer times starting at 0 - Some basic settings for rspec include:
-
dt uniform times with spacing dt ,t_(max),dt}")
times ") to
to ") with spacing dt
with spacing dt{{t1,t2,…}} explicit times {t1,t2,…} daytype day type specification - Possible daytype values include "Weekday", "Weekend", Monday through Sunday, "BeginningOfMonth", "EndOfMonth", "BusinessDay" and "Holiday".
- If dt is set to Automatic, the minimum time increment in tseries is used.
- The following settings for rspec are useful if tseries contains multiple paths:
-
"Union" use all times present in tseries "Intersection" use times common to all paths {"Times",p} use times from path p - TimeSeriesResample takes the following options:
-
ResamplingMethod Automatic method to use for resampling CalendarType Automatic calendar system to interpret the dates HolidayCalendar Automatic holiday calendar schedule for business days TimeZone Automatic time zone specification for dates
Examples
open all close allBasic Examples (2)
Resample a TimeSeries:
ts = TimeSeries[{1.2, 1.8, 1.3, .4, 1.5}, {{1, 2, 3, 4, 7}}]TimeSeriesResample[ts, .5]ListPlot[#, Filling -> {2 -> 0}]& /@ {ts, %}Resample a multi-path TemporalData:
data = RandomFunction[PoissonProcess[.3], {1, 50}, 3]This data is not uniformly sampled:
ListPlot[data]rdata = TimeSeriesResample[data, 1];ListPlot[rdata]Scope (14)
Basic Uses (3)
data = RandomFunction[PoissonProcess[30], {1, 5}]ListPlot[data]ds = TimeSeriesResample[data, .25]ListPlot[ds]Sample multiple paths at the same time:
data = RandomFunction[PoissonProcess[10], {1, 5}, 20]ListPlot[data]ds = TimeSeriesResample[data, 0.01]ListPlot[ds]Take a time series of stock prices in March 2023:
ts = FinancialData["SBUX", {"March 2023"}];Resample at a daily resolution, interpolating holidays and weekends:
tsR = TimeSeriesResample[ts, "Day"]DateListPlot[#, Joined -> False, Filling -> 0]& /@ {ts, tsR}Data Types (6)
Resample a time series in the form of a vector:
data = {Subscript[x, 1], Subscript[x, 2], Subscript[x, 3], Subscript[x, 4], Subscript[x, 5]};TimeSeriesResample[data, 1 / 2]//SimplifyTimeSeriesResample[data, 2]A time series given as time-value pairs:
data = {{1, Subscript[x, 1]}, {2, Subscript[x, 2]}, {3, Subscript[x, 3]}, {4, Subscript[x, 4]}, {5, Subscript[x, 5]}};TimeSeriesResample[data, 1 / 2]//SimplifyTimeSeriesResample[data, 2]Resample a TimeSeries:
data = TimeSeries[{{1, Subscript[x, 1]}, {2, Subscript[x, 2]}, {3, Subscript[x, 3]}, {4, Subscript[x, 4]}, {5, Subscript[x, 5]}}]TimeSeriesResample[data, 1 / 2]//Normal//SimplifyTimeSeriesResample[data, 2]//Normal//SimplifyBy default, an EventSeries is not interpolated:
data = EventSeries[{{1, Subscript[x, 1]}, {2, Subscript[x, 2]}, {4, Subscript[x, 4]}}]TimeSeriesResample[data, 1]//NormalSetting the ResamplingMethod overrides this:
TimeSeriesResample[data, 1, ResamplingMethod -> {"Constant", c}]//NormalA single path given as TemporalData:
data = TemporalData[{{1, Subscript[x, 1]}, {2, Subscript[x, 2]}, {3, Subscript[x, 3]}, {4, Subscript[x, 4]}, {5, Subscript[x, 5]}}]TimeSeriesResample[data, 1 / 2]["Path"]TimeSeriesResample[data, 2]["Path"]Multiple paths given as TemporalData:
data = TemporalData[{{Subscript[x, 1], Subscript[x, 2], Subscript[x, 3], Subscript[x, 4], Subscript[x, 5]}, {Subscript[y, 1], Subscript[y, 2], Subscript[y, 3], Subscript[y, 4], Subscript[y, 5]}}, {1}]TimeSeriesResample[data, .5]["Paths"]TimeSeriesResample[data, 2]["Paths"]Sampling (5)
Resample according to the smallest time increment in a TemporalData:
data = RandomFunction[PoissonProcess[3], {1, 100}]rdata = TimeSeriesResample[data]The original data was irregular, while the resampled data is regular:
RegularlySampledQ /@ {data, rdata}Larger step values dt give coarser sampling:
data = RandomFunction[PoissonProcess[3], {1, 100}]Table[ListPlot[TimeSeriesResample[data, dt], PlotLabel -> dt], {dt, {1, 5, 10}}]Use a time quantity as a sampling increment for calendar timestamps:
data = FinancialData["APP", "2022"]TimeSeriesResample[data, Quantity[2, "Months"]]DateListPlot[{data, %}]Resample time series with dates:
ts = TimeSeries[Range[20], {DateObject[{2026, 1, 30}], Automatic, "Day"}]TimeSeriesResample[ts, "BusinessDay"]DateListPlot[{ts, %}, Joined -> {True, False}, Filling -> {2 -> 0}]TimeSeriesResample[ts, "Weekend"]DayName /@ %["Timestamps"]TimeSeriesResample[ts, Wednesday]%//Normaltd = TemporalData[{{{1, x1}, {2, x2}, {2.1, x3}, {3, x4}, {4, x5}}, {{1, y1}, {1.5, y2}, {2, y3}, {2.5, y4}, {3, y5}, {3.5, y6}, {5, y7}}}]TimeSeriesResample[td, "Union"]%["Times"]TimeSeriesResample[td, "Intersection"]%["Times"]Use times from the first path:
TimeSeriesResample[td, {"Times", 1}]%["Times"]Options (4)
ResamplingMethod (3)
Specify the interpolation order in resampling:
data = TimeSeries[{1, 2, 3, 4}, {{1, 3, 4, 7}}]TimeSeriesResample[data, ResamplingMethod -> {"Interpolation", InterpolationOrder -> 2}]//NormalBy default, the method setting for the data is used:
TimeSeriesResample[data]//Normaldata["ResamplingType"]Setting ResamplingMethod to None gives missing resampled values:
data = TimeSeries[{1, 2, 3, 4}, {{0, 3, 4, 6}}]TimeSeriesResample[data, 1, ResamplingMethod -> None]//NormalResample using a constant value:
data = TimeSeries[{10, 20, 40, 70}, {{.1, .5, .7, .9}}]TimeSeriesResample[data, ResamplingMethod -> {"Constant", Mean[data]}]//NormalHolidayCalendar (1)
Take a time series with calendar timestamps:
data = TemporalData[Range[8], {DateObject[{2025, 4, 17}]}]TimeSeriesResample[data, "BusinessDay", HolidayCalendar -> "UnitedStates"]Normal[%]Resample on business days in Germany:
TimeSeriesResample[data, "BusinessDay", HolidayCalendar -> "Germany"]Normal[%]Applications (5)
Take a time series of daily step counts:
stepdata = TimeSeries[TimeEventSeries`TimestampData[Association["UniformlySpacedQ" -> True, "Count" -> 154,
   "Endpoints" -> TabularColumn[Association[
      "Data" -> {2, {{NumericArray[{15796, 15949}, "Integer32"], {}, None}}, None},
      "ElementType"  ...  {}, None}, "ElementType" -> "Integer64"]],
 Association["ResamplingMethod" -> "LinearInterpolation", "TimeObservationWindow" ->
   DateInterval[{{{2013, 4, 1, 0, 0, 0.}, {2013, 9, 1, 0, 0, 0.}}}, "Day", "Gregorian", -6., "UT",
    Automatic]]];
Select the values for each day of the week:
weekdays = {Monday, Tuesday, Wednesday, Thursday, Friday, Saturday, Sunday};
wk = Map[TimeSeriesResample[stepdata, #]&, weekdays];
Compute the mean number of steps for each day of the week:
avg = Map[Floor[Mean[#]]&, wk];Visualize the mean steps per day:
BarChart[avg, ...]Financial information is generated only for business days:
data = FinancialData["SBUX", "Close", {{2013, 12, 1}, {2013, 12, 31}}]The automatically created time series is not regularly sampled with respect to calendar days:
RegularlySampledQ[data]Resample according to "BusinessDay" to create a uniformly sampled time series:
ts = TimeSeriesResample[data, "BusinessDay"]RegularlySampledQ[ts]data["Path"] == ts["Path"]Financial information is generated only for business days:
data = FinancialData["SBUX", "Close", {{2025, 11, 20}, {2026, 1, 5}}]There are no changes on the non-business days, hence it can be resampled by day by keeping the value from the left:
TimeSeriesResample[data, ResamplingMethod -> "PreviousElement"]The plot is flat over the weekends and holidays:
DateListPlot[%]Use AirPressureData to examine pressure changes due to Hurricane Sandy at Long Island MacArthur Airport:
pressure = AirPressureData["KISP", {DateObject[{2012, 10, 27}], DateObject[{2012, 10, 30}]}]DateListPlot[pressure, FrameLabel -> Automatic]The data is not regularly sampled:
RegularlySampledQ[pressure]To analyze the rate of change, data needs to be resampled into a regularly sampled time series:
res = TimeSeriesResample[pressure, {DateObject[{2012, 10, 27}], Automatic, "Hour"}]RegularlySampledQ[res]Plotting each observation disjointly shows the rate of change of the pressure, with larger spacing indicating faster changes:
DateListPlot[res, Joined -> False]Analyze the monthly temperatures in Champaign during 2014:
ts = TimeSeries[TimeEventSeries`TimestampData[Association["UniformlySpacedQ" -> True, "Count" -> 365,
   "Endpoints" -> TabularColumn[Association[
      "Data" -> {2, {{{1388534400000, 1419984000000}, {}, None}}, None},
      "ElementType" -> "Date"[" ...       7.78, 6.83, -1.39, -3.89, -4.06, -3.17, -0.72, -0.89, 7.78, 6.22, 2.28, 3.28, 8.17, 0.11,
        -4.44, -2, -10.28}, {}, None}}, None}, "ElementType" ->
    TypeSpecifier["Quantity"]["NumberExpression", "DegreesCelsius"]]], Association[]];
The raw data comes in one-day increments:
ts["MinimumTimeIncrement"]monthlyTemps = TimeSeriesResample[ts, "Month"]monthlyTemps["MinimumTimeIncrement"]Comap[{Min, Mean, Max}, monthlyTemps]Comap[{Min, Mean, Max}, ts]DateListPlot[{ts, monthlyTemps}, PlotLegends -> {"daily temperatures", "resampled monthly"}, FrameLabel -> Automatic]Properties & Relations (2)
ts = TimeSeries[{1, -1.4, -0.5, 2.2, 0.6, 3.5}, {0}]Resampling with spacing smaller than the minimum time increment will add timestamps:
TimeSeriesResample[ts, .5]Resample with spacing larger than the minimum time increment:
TimeSeriesResample[ts, 1.3]Specifying the resampling range outside the time domain will extrapolate the time series:
ts = TimeSeries[{1.2, 1.8, -.3, .4, 1.5}, {{1, 2, 3, 4, 7}}]TimeSeriesResample[ts, {0, 10, .5}]ListLinePlot[{ts, %}, Filling -> {1 -> 0}]Text
Wolfram Research (2014), TimeSeriesResample, Wolfram Language function, https://reference.wolfram.com/language/ref/TimeSeriesResample.html (updated 2026).
CMS
Wolfram Language. 2014. "TimeSeriesResample." Wolfram Language & System Documentation Center. Wolfram Research. Last Modified 2026. https://reference.wolfram.com/language/ref/TimeSeriesResample.html.
APA
Wolfram Language. (2014). TimeSeriesResample. Wolfram Language & System Documentation Center. Retrieved from https://reference.wolfram.com/language/ref/TimeSeriesResample.html