"Isomap" (Machine Learning Method)
- Method for DimensionReduction, DimensionReduce, FeatureSpacePlot and FeatureSpacePlot3D.
- Reduce the dimension of data using an isometric mapping.
Details & Suboptions
- "Isomap", which stands for isometric mapping, is a nonlinear neighbor-based dimensionality reduction method. The method attempts to find a low-dimensional embedding of data via a transformation that preserves geodesic distances.
- "Isomap" is able to learn nonlinear manifolds; however, it gives poor results on boundaries, can fail if data has high-density variations, and is computationally expensive.
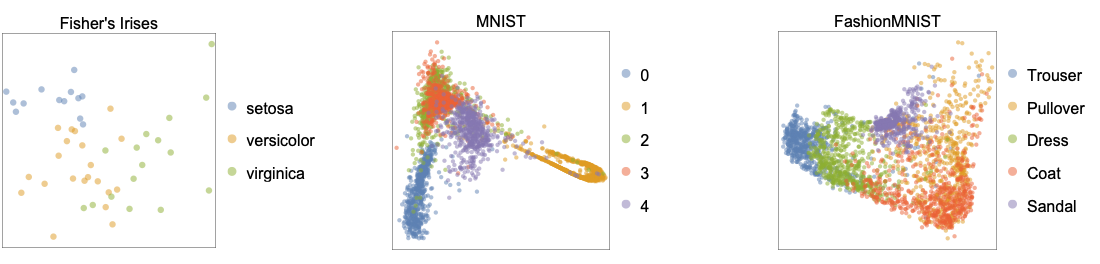
- The following plots show two-dimensional embeddings learned by the "Isomap" method applied to the benchmark datasets Fisher's Irises, MNIST and FashionMNIST:
- "Isomap" constructs a neighborhood graph on
 data points given their
  nearest neighbors. The geodesic distances between all pairs of points on the manifold are estimated by the shortest path in the nearest neighbors graph,
  , which results in the matrix of graph distances
  . The method attempts to find the embedding for which the Euclidean distance (shortest distance) is equal to the geodesic distance. The lower-dimensional embeddings
  are computed by minimizing the embedding cost: min ∑ Ni=1 [||yi-yj||- dij
 ]2
]2 - The method is equivalent to performing the classical "MultidimensionalScaling" on the matrix of graph distances
 . Consequently, the Euclidean distances in the embedding space match the graph distances: ||yi-yj||≈ dijG.
 - The following suboption can be given:
-
"NeighborsNumber" Automatic number of neighbors k
Examples
open all close allBasic Examples (1)
Create and visualize a "Swiss roll" dataset:
SeedRandom[12]
data = Table[Insert[AngleVector[1 + {2, 8} * RandomReal[]], RandomReal[], 2], 1000];ListPointPlot3D[data, BoxRatios -> {1, 1, 1}, PlotStyle -> Directive[PointSize -> Large]]Train a nonlinear dimension reducer using "Isomap" on the dataset to map to two-dimensional space:
reducer = DimensionReduction[data, 2, Method -> "Isomap"]Find and visualize the data coordinates in the reduced space:
reducedpts = reducer[data];
ListPlot[Style[#, Hue[First[#] / 20]] & /@ reducedpts, AspectRatio -> 1 / 2, PlotStyle -> Directive[PointSize -> Small]]
Visualize the dataset in the original space, with each point colored according to its reduced variable:
ListPointPlot3D[Style[#, Hue[First[reducer[#]] / 20]] & /@ data, PlotStyle -> Directive[PointSize -> Large], BoxRatios -> {1, 1, 1}]Scope (1)
Dataset Visualization (1)
Load the Fisher Iris dataset from ExampleData:
iris = ExampleData[{"MachineLearning", "FisherIris"}, "Data"];RandomSample[iris, 5]Generate a reducer function using "Isomap" with the features of each example:
diris = DimensionReduction[iris[[All, 1]], 2, Method -> "Isomap"]Group the examples by their species:
byspecies = GroupBy[iris, Last -> First];Reduce the dimension of the features:
byspecies = diris /@ byspecies;Visualize the reduced dataset:
ListPlot[Values[byspecies], PlotLegends -> Keys[byspecies]]Options (1)
"NeighborsNumber" (1)
Generate a dataset of different head poses from 3D geometry data with random viewpoints:
SeedRandom[123]
cc = RandomPoint[Circle[{0, 0}, 0.8, {Pi, 2Pi}], 50];
pp = Flatten[Table[{cc[[i, 1]], cc[[i, 2]], j}, {i, 1, Length@cc}, {j, -0.8, 0.8, 0.2}], 1];
vp = RandomSample[pp, 60];
obj = ExampleData[{"Geometry3D", "Beethoven"}];
poses = Table[Show[obj, ViewPoint -> vp[[i]]], {i, 1, Length@vp}];
imgs = Table[Rasterize[poses[[i]], ImageResolution -> 64, ImageSize -> 50, Background -> None], {i, 1, Length@poses}];
Visualize different head poses:
RandomSample[imgs, 10]Reduce the dataset to a two-dimensional representation by specifying the "NeighborsNumber" in the neighborhood graph for performing the isometric mapping:
red = DimensionReduce[imgs, 2, Method -> {"Isomap", "NeighborsNumber" -> 10}];Visualize the original images in the reduced space, in which the up-down and front-side poses are disentangled:
Graphics[MapThread[Inset[#1, #2, {0, 0}, 15, Background -> None]&, {imgs, red}], ImageSize -> 300, ImagePadding -> 15, Frame -> False, AspectRatio -> 1]