


Cepstrogram
Cepstrogram[data]
plots the array of power cepstra computed on each partition of data.
Cepstrogram[data,n]
uses partitions of length n.
Cepstrogram[data,n,d]
uses partitions with offset d.
Cepstrogram[data,n,d,wfun]
applies a smoothing window wfun to each partition.
Cepstrogram[data,n,d,wfun,m]
pads partitions with zeros to length m prior to the computation of the transform.
Details and Options
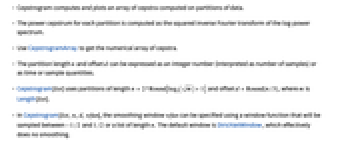
- Cepstrogram computes and plots an array of cepstra computed on partitions of data.
- The power cepstrum for each partition is computed as the squared inverse Fourier transform of the log-power spectrum.
- Use CepstrogramArray to get the numerical array of cepstra.
- The partition length n and offset d can be expressed as an integer number (interpreted as number of samples) or as time or sample quantities.
- Cepstrogram[list] uses partitions of length
 and offset
  , where m is Length[list].
 - In Cepstrogram[list,n,d,wfun], the smoothing window wfun can be specified using a window function that will be sampled between
 and
and  or a list of length n. The default window is DirichletWindow, which effectively does no smoothing.
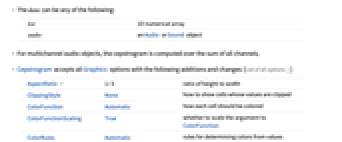
 - The data can be any of the following:
-
list 1D numerical array audio an Audio or Sound object video a Video object - For multichannel audio objects, the cepstrogram is computed over the sum of all channels.
- Cepstrogram accepts all Graphics options with the following additions and changes: [List of all options]
-
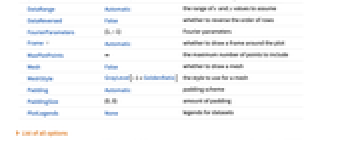
AspectRatio 1/3 ratio of height to width ClippingStyle None how to show cells whose values are clipped ColorFunction Automatic how each cell should be colored ColorFunctionScaling True whether to scale the argument to ColorFunction ColorRules Automatic rules for determining colors from values DataRange Automatic the range of  and
and  values to assume
 DataReversed False whether to reverse the order of rows FourierParameters {1,-1} Fourier parameters Frame Automatic whether to draw a frame around the plot MaxPlotPoints ∞ the maximum number of points to include Mesh False whether to draw a mesh MeshStyle GrayLevel[-1+GoldenRatio] the style to use for a mesh Padding Automatic padding scheme PaddingSize {0,0} amount of padding PlotLegends None legends for datasets -
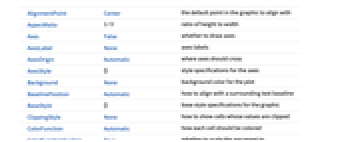
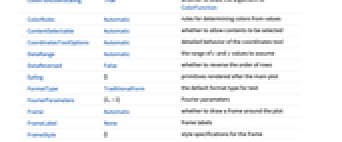
AlignmentPoint Center the default point in the graphic to align with AspectRatio 1/3 ratio of height to width Axes False whether to draw axes AxesLabel None axes labels AxesOrigin Automatic where axes should cross AxesStyle {} style specifications for the axes Background None background color for the plot BaselinePosition Automatic how to align with a surrounding text baseline BaseStyle {} base style specifications for the graphic ClippingStyle None how to show cells whose values are clipped ColorFunction Automatic how each cell should be colored ColorFunctionScaling True whether to scale the argument to ColorFunction ColorRules Automatic rules for determining colors from values ContentSelectable Automatic whether to allow contents to be selected CoordinatesToolOptions Automatic detailed behavior of the coordinates tool DataRange Automatic the range of  and
and  values to assume
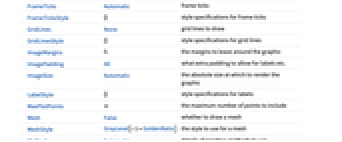
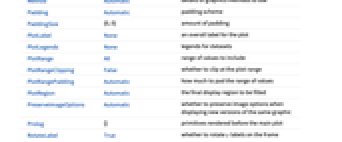
 DataReversed False whether to reverse the order of rows Epilog {} primitives rendered after the main plot FormatType TraditionalForm the default format type for text FourierParameters {1,-1} Fourier parameters Frame Automatic whether to draw a frame around the plot FrameLabel None frame labels FrameStyle {} style specifications for the frame FrameTicks Automatic frame ticks FrameTicksStyle {} style specifications for frame ticks GridLines None grid lines to draw GridLinesStyle {} style specifications for grid lines ImageMargins 0. the margins to leave around the graphic ImagePadding All what extra padding to allow for labels etc. ImageSize Automatic the absolute size at which to render the graphic LabelStyle {} style specifications for labels MaxPlotPoints ∞ the maximum number of points to include Mesh False whether to draw a mesh MeshStyle GrayLevel[-1+GoldenRatio] the style to use for a mesh Method Automatic details of graphics methods to use Padding Automatic padding scheme PaddingSize {0,0} amount of padding PlotLabel None an overall label for the plot PlotLegends None legends for datasets PlotRange All range of values to include PlotRangeClipping False whether to clip at the plot range PlotRangePadding Automatic how much to pad the range of values PlotRegion Automatic the final display region to be filled PreserveImageOptions Automatic whether to preserve image options when displaying new versions of the same graphic Prolog {} primitives rendered before the main plot RotateLabel True whether to rotate y labels on the frame Ticks Automatic axes ticks TicksStyle {} style specifications for axes ticks
List of all options
Examples
open all close allScope (2)
Options (50)
AspectRatio (3)
By default, Cepstrogram uses a fixed height to width ratio for the plot:
Make the height the same as the width with AspectRatio1:
AspectRatioFull adjusts the height and width to tightly fit inside other constructs:
Axes (4)
By default, Cepstrogram uses a frame instead of axes:
Use AxesOrigin to specify where the axes intersect:
AxesOrigin (2)
AxesStyle (4)
Frame (4)
Cepstrogram uses a frame by default:
Use FrameFalse to turn off the frame:
FrameLabel (2)
FrameTicks (6)
Frame ticks are placed automatically by default:
By default, the top and right edges have neither tick marks nor tick labels:
Use All to include tick labels on all edges:
Place tick marks at the specified positions:
Draw frame tick marks at the specified positions with specific labels:
Specify the lengths for tick marks as a fraction of the plot size:
Use different sizes in the positive and negative directions for tick marks:
FrameTicksStyle (3)
ImageSize (7)
Use named sizes such as Tiny, Small, Medium and Large:
Specify the width of the plot:
Specify the height of the plot:
Allow the width and height to be up to a certain size:
Specify the width and height for a graphic, padding with space if necessary:
Setting AspectRatioFull will fill the available space:
Use maximum sizes for the width and height:
Use ImageSizeFull to fill the available space in an object:
Specify the image size as a fraction of the available space:
Ticks (6)
Ticks are placed automatically on each axis:
Use TicksNone to draw axes without any tick marks:
Place tick marks at the specified positions:
Draw tick marks at the specified positions with specific labels:
Specify the lengths for ticks as a fraction of graphics size:
Use different sizes in the positive and negative directions for ticks:
Applications (2)
Properties & Relations (2)
On multichannel Sound or Audio, cepstrogram is computed on the sum of the channels:
Create a cepstrogram from the CepstrogramArray:
Comparison with the Cepstrogram output:
Text
Wolfram Research (2017), Cepstrogram, Wolfram Language function, https://reference.wolfram.com/language/ref/Cepstrogram.html (updated 2024).
CMS
Wolfram Language. 2017. "Cepstrogram." Wolfram Language & System Documentation Center. Wolfram Research. Last Modified 2024. https://reference.wolfram.com/language/ref/Cepstrogram.html.
APA
Wolfram Language. (2017). Cepstrogram. Wolfram Language & System Documentation Center. Retrieved from https://reference.wolfram.com/language/ref/Cepstrogram.html