

HighlightImage
HighlightImage[image,roi]
highlights the specified region of interest roi in image.
HighlightImage[image,{roi1,roi2,…}]
highlights several regions of interest roii.
HighlightImage[image,{…,w[roii],…}]
highlights using a feature defined by the symbolic wrapper w.
HighlightImage[image,fg,bgstyle]
applies the styling bgstyle to the complement of all the regions of interest.
Details and Options
- HighlightImage is used for highlighting particular regions or features in an image. It returns the highlighted image as a Graphics object.
- The region of interest roi can be any of the following:
-
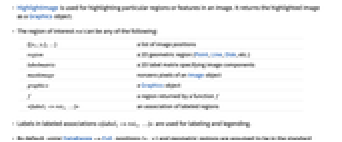
{{x1,y1},…} a list of image positions region a 2D geometric region (Point, Line, Disk, etc.) labelmatrix a 2D label matrix specifying image components maskimage nonzero pixels of an Image object graphics a Graphics object f a region returned by a function f <label1->roi1, …> an association of labeled regions - Labels in labeled associations <label1->roi1, …> are used for labeling and legending.
- By default, using DataRange->Full, positions {xi,yi} and geometric regions are assumed to be in the standard image coordinate system.
- The following wrappers w can be used:
-
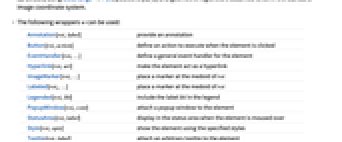
Annotation[roi,label] provide an annotation Button[roi,action] define an action to execute when the element is clicked EventHandler[roi,…] define a general event handler for the element Hyperlink[roi,uri] make the element act as a hyperlink ImageMarker[roi,…] place a marker at the medoid of roi Labeled[roii,…] place a marker at the medoid of roi Legended[roi,lbl] include the label lbl in the legend PopupWindow[roi,cont] attach a popup window to the element StatusArea[roi,label] display in the status area when the element is moused over Style[roi,opts] show the element using the specified styles Tooltip[roi,label] attach an arbitrary tooltip to the element - Use HighlightImage[image,{…,style,roi,…}] to specify a style for the region roi.
- Basic style specifications include:
-
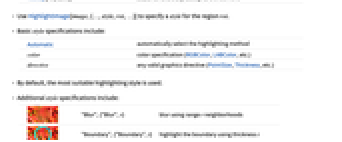
Automatic automatically select the highlighting method color color specification (RGBColor, LABColor, etc.) directive any valid graphics directive (PointSize, Thickness, etc.) - By default, the most suitable highlighting style is used.
- Additional style specifications include:
-

"Blur",{"Blur",r} blur using range r neighborhoods 
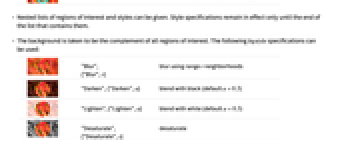
"Boundary",{"Boundary",t} highlight the boundary using thickness t - Nested lists of regions of interest and styles can be given. Style specifications remain in effect only until the end of the list that contains them.
- The background is taken to be the complement of all regions of interest. The following bgstyle specifications can be used:
-
"Blur",
{"Blur",r}blur using range r neighborhoods 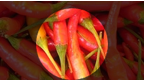
"Darken",{"Darken",a} blend with black (default  )
)
"Lighten",{"Lighten",a} blend with white (default  )
)
"Desaturate",{"Desaturate",s} desaturate 
"Remove" make background transparent 
{"Remove",color} replace background with color 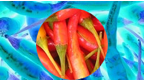
f perform f on the background - With an explicit bgstyle, the foreground opacity is set to 0. Use Opacity[α] to specify a different foreground opacity.
- HighlightImage accepts all Graphics options with the following changes and additions: [List of all options]
-
DataRange Full range of coordinates in the original image ImageLabels Automatic how to label regions of interest ImageLegends None how to add a legend PlotRange Automatic range of coordinates to include PlotRangePadding None how much to pad the range of values - Possible settings for ImageLabels and ImageLegends include:
-
{lbl1,lbl2,…} use an explicit lbli for roii Automatic automatic labeling and legending None no label or legend "Expressions" use the arbitrary functions f - Typical settings for DataRange include:
-
Automatic {{0,1},{0,h/w}} Full {{0,w},{0,h}} {{left,right},{bottom,top}} explicit coordinate ranges in 2D - Typical settings for PlotRange include:
-
All all points are included Automatic same as DataRange settings {{left,right},{bottom,top}} explicit coordinate ranges -
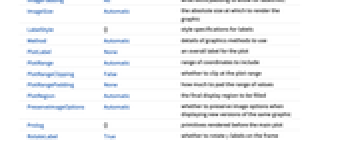
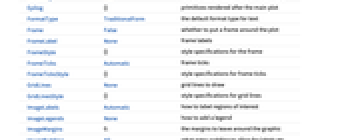
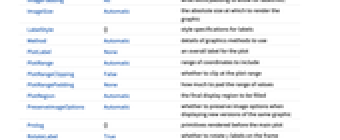
AlignmentPoint Center the default point in the graphic to align with AspectRatio Automatic ratio of height to width Axes False whether to draw axes AxesLabel None axes labels AxesOrigin Automatic where axes should cross AxesStyle {} style specifications for the axes Background None background color for the plot BaselinePosition Automatic how to align with a surrounding text baseline BaseStyle {} base style specifications for the graphic ContentSelectable Automatic whether to allow contents to be selected CoordinatesToolOptions Automatic detailed behavior of the coordinates tool DataRange Full range of coordinates in the original image Epilog {} primitives rendered after the main plot FormatType TraditionalForm the default format type for text Frame False whether to put a frame around the plot FrameLabel None frame labels FrameStyle {} style specifications for the frame FrameTicks Automatic frame ticks FrameTicksStyle {} style specifications for frame ticks GridLines None grid lines to draw GridLinesStyle {} style specifications for grid lines ImageLabels Automatic how to label regions of interest ImageLegends None how to add a legend ImageMargins 0. the margins to leave around the graphic ImagePadding All what extra padding to allow for labels etc. ImageSize Automatic the absolute size at which to render the graphic LabelStyle {} style specifications for labels Method Automatic details of graphics methods to use PlotLabel None an overall label for the plot PlotRange Automatic range of coordinates to include PlotRangeClipping False whether to clip at the plot range PlotRangePadding None how much to pad the range of values PlotRegion Automatic the final display region to be filled PreserveImageOptions Automatic whether to preserve image options when displaying new versions of the same graphic Prolog {} primitives rendered before the main plot RotateLabel True whether to rotate y labels on the frame Ticks Automatic axes ticks TicksStyle {} style specifications for axes ticks
List of all options
Examples
open all close allBasic Examples (3)
Scope (23)
Regions (8)
Point Regions (1)
Use an explicit Point wrapper:
Use an ImageMarker wrapper:
Area Regions (3)
Use an Image object as the region:
Use a Graphics primitive to describe what to highlight:
Use a Graphics object as the region:
Use a geometric region to describe what to highlight:
The region of interest can be a Graphics object generated by any function:
Whenever the region is given as an image, it is assumed to be a 2D region:
Highlight only the detected pixels by removing the boundary:
Compare the result with the exact pixel-wise color replacement:
Label Matrices (2)
Styling (15)
Region Styling (3)
Highlight the region using a solid color:
Highlight the boundary of a region:
Use Graphics directives to customize the region:
Background Styling (6)
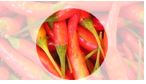
Highlight the image by decreasing the background brightness:
Highlight the image by increasing the background brightness:
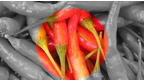
Highlight the region of interest by converting the background to gray scale:
Use a specific saturation value:
Blur the background to highlight the foreground:
Labeling & Legending (5)
Options (7)
DataRange (1)
ImageLabels (2)
By default, no label is used for the highlighted regions:
Use ImageLabels{"lbl1","lbl2",…} to define labels for each region:
Association keys are automatically used as labels:
Use ImageLabelsNone to disable automatic labeling:
ImageLegends (2)
Use ImageLegends{"lbl1","lbl2",…} to define labels for each region:
Legends are matched by scanning the list of regions depth first:
Association keys automatically used as labels:
Use ImageLegendsAutomatic to enable automatic legending:
Use ImageLabelsNone to also disable labeling:
Applications (5)
Perform and visualize a semantic segmentation of an image using a neural network:
Define an evaluator function that can work on any image dimension:
Highlight segments and use legends to show labels:
Highlight strong and weak corners in different styles:
Segment an image and highlight the centers of the disk shapes with a marker:
Text
Wolfram Research (2012), HighlightImage, Wolfram Language function, https://reference.wolfram.com/language/ref/HighlightImage.html (updated 2021).
CMS
Wolfram Language. 2012. "HighlightImage." Wolfram Language & System Documentation Center. Wolfram Research. Last Modified 2021. https://reference.wolfram.com/language/ref/HighlightImage.html.
APA
Wolfram Language. (2012). HighlightImage. Wolfram Language & System Documentation Center. Retrieved from https://reference.wolfram.com/language/ref/HighlightImage.html