

Arrow
更多信息
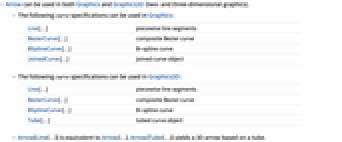
- Arrow 可用于 Graphics 和 Graphics3D(二维和三维图形).
- 下列 curve 的具体说明可以用于 Graphics 中:
-
Line[…] 分段线段 BezierCurve[…] 合成 Bezier 曲线 BSplineCurve[…] B-样条曲线 JoinedCurve[…] 连接的曲线对象 - 下列 curve 的具体说明可以用于 Graphics3D 中:
-
Line[…] 分段线段 BezierCurve[…] 合成 Bezier 曲线 BSplineCurve[…] B-样条曲线 Tube[…] 管状曲线对象 - Arrow[Line[…]] 等价于 Arrow[…]. Arrow[Tube[…]] 生成一个基于管状的三维箭头.
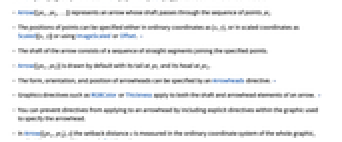
- Arrow[{pt1,pt2,…}] 表示箭杆穿过点序列 pti 的箭头标记.
- 这些点的位置既可以用常规坐标 {x,y} 的形式指定,也可以用尺度缩放的坐标 Scaled[{x,y}],或者ImageScaled 或 Offset 的形式指定. »
- 箭杆由连接指定点的直线段序列构成.
- Arrow[{pt1,pt2}] 缺省下绘制尾部在 pt1,头部在 pt2 的箭头标记.
- 箭头标记的形式、方向和位置可以用 Arrowheads 指令进行指定. »
- RGBColor 或 Thickness 一类的图形指令既应用于箭头标记的箭杆,也可以应用于其箭头头部. »
- 指定箭头标记的明确指令来防止图形指令应用于一个箭头头部.
- 在 Arrow[{pt1,pt2},s] 中,缩回距离 s 是在整个图形的普通坐标系统中进行测定,以使该箭头刚好触到 Disk[pti,s]. »
- 如果整个图形没有设置 AspectRatio->Automatic,则指定的箭头标记的缩回距离可能会在图形中不同方向都具有相应的不同距离.
范例
打开所有单元 关闭所有单元基本范例 (6)
Graphics[Arrow[{{1, 0}, {2, 1}, {3, 0}, {4, 1}}]]Graphics3D[Arrow[{{1, 1, -1}, {2, 2, 0}, {3, 3, -1}, {4, 4, 0}}]]Graphics3D[{Red, Arrowheads[0.1], Arrow[Tube[{{1, 1, -1}, {2, 2, 0}, {3, 3, -1}, {4, 4, 0}}, 0.05]]}]{Graphics[{Arrow[BezierCurve[{{0, 0}, {1, 1}, {2, -1}}]]}], Graphics3D[{Arrow[BSplineCurve[{{0, 0, 0}, {1, 1, 1}, {2, -1, 1}, {3, 0, 2}}]]}]}{Graphics[{Arrowheads[{-.1, .1}], Arrow[{{0, 0}, {1, 1 / 3}}]}], Graphics3D[{Arrowheads[{-.1, .1}], Arrow[{{0, 0, 0}, {2, 1, 1}}]}], Graphics3D[{Arrowheads[{-.1, .1}], Arrow[Tube[{{0, 0, 0}, {2, 1, 1}}]]}]}a = {Arrowheads[Large], Arrow[{{0, 0}, {1, .5}}]};{Graphics[{Dashed, a}], Graphics[{Red, a}], Graphics[{Thick, a}], Graphics[{Thick, Dashed, Red, a}]}范围 (17)
箭头规范 (7)
Graphics[Arrow[{{0, 0}, {2, 1}}]]Graphics[Arrow[{{0, 0}, {2, 1}, {4, 0}}]]{Graphics[Arrow[Line[{{0, 0}, {2, 1}}]]], Graphics3D[Arrow[Line[{{0, 0, 0}, {2, 1, 1}}]]], Graphics3D[Arrow[Tube[{{0, 0, 0}, {2, 1, 1}}]]]}{Graphics[Arrow[BezierCurve[{{0, 0}, {1, 2}, {4, 2}}]]], Graphics3D[Arrow[BSplineCurve[{{0, 0, 0}, {1, 2, 2}, {4, 2, 2}}]]], Graphics3D[Arrow[Tube[BSplineCurve[{{0, 0, 0}, {1, 2, 2}, {4, 2, 2}}]]]]}s = {{0, 0}, {2, 1.5}, {4, 0}};{Graphics[Arrow[Line[{s, s + 1}]]], Graphics[Arrow[BezierCurve[{s, s + 1}]]]}{Graphics[{Arrow[{{0, 0}, {2, 1}}], Circle[{2, 1}, .3]}], Graphics[{Arrow[{{0, 0}, {2, 1}}, .3], Circle[{2, 1}, .3]}]}{Graphics[{Arrow[BSplineCurve[{{0, 0}, {1, -1}, {2, 1}}]], Circle[{2, 1}, .3]}], Graphics[{Arrow[BSplineCurve[{{0, 0}, {1, -1}, {2, 1}}], .3], Circle[{2, 1}, .3]}]}{Graphics3D[{Opacity[.8], Arrow[{{0, 0, 0}, {2, 1, 0}}], Sphere[{2, 1, 0}, .3]}], Graphics3D[{Opacity[.8], Arrow[{{0, 0, 0}, {2, 1, 0}}, .3], Sphere[{2, 1, 0}, .3]}]}箭头样式 (7)
Table[Graphics[{Thickness[i], Arrow[{{0, 0}, {2, 1}}]}], {i, {Tiny, Small, Medium, Large}}]Table[Graphics3D[{Thickness[i], Arrow[{{0, 0, 0}, {2, 1, 1}}]}], {i, {Tiny, Small, Medium, Large}}]{Graphics[{Dashed, Arrow[{{0, 0}, {2, 1}}]}], Graphics[{Dotted, Arrow[{{0, 0}, {2, 1}}]}], Graphics[{DotDashed, Arrow[{{0, 0}, {2, 1}}]}]}{Graphics3D[{Dashed, Arrow[{{0, 0, 0}, {2, 1, 1}}]}], Graphics3D[{Dotted, Arrow[{{0, 0, 0}, {2, 1, 1}}]}], Graphics3D[{DotDashed, Arrow[{{0, 0, 0}, {2, 1, 1}}]}]}Table[Graphics[{c, Arrow[{{0, 0}, {2, 1}}]}], {c, {Red, Green, Blue}}]Table[Graphics3D[{c, Arrow[{{0, 0, 0}, {2, 1, 1}}]}], {c, {Red, Green, Blue}}]Table[Graphics[{Arrowheads[i], Arrow[{{0, 0}, {1, .5}}]}], {i, {Tiny, Small, Medium, Large}}]Table[Graphics[{Arrowheads[i], Arrow[BezierCurve[{{0, 0}, {1, -1}, {2, 1}}]]}], {i, {.1, .2, .3, .4}}]Table[Graphics3D[{Arrowheads[i], Arrow[{{0, 0, 0}, {2, 1, 1}}]}], {i, {Tiny, Small, Medium, Large}}]Table[Graphics3D[{Arrowheads[i], Arrow[Tube[{{0, 0, 0}, {2, 1, 1}}, 0.02]]}], {i, {Tiny, Small, Medium, Large}}]Graphics 可以用作二维和三维箭头的头部:
h = Graphics[Line[{{-1, 1 / 2}, {0, 0}, {-1, -1 / 2}, {-1, 1 / 2}}]];{Graphics[{Arrowheads[{{-.1, 0, {h, 1}}, {.1, 1, {h, 1}}}], Arrow[{{0, 0}, {2, 1}}]}], Graphics[{Arrowheads[{{-.1, 0, {h, 1}}, {.1, 1, {h, 1}}}], Arrow[BezierCurve[{{0, 0}, {1, -1}, {2, 1}}]]}]}h = Graphics[{Green, Polygon[{{-1, 1 / 2}, {0, 0}, {-1, -1 / 2}, {-1, 1 / 2}}]}];Graphics3D[{Arrowheads[{{-.1, 0, {h, 1}}, {.1, 1, {h, 1}}}, Appearance -> "Projected"], Arrow[{{0, 0, 0}, {2, 1, 1}}]}]使用 Graphics3D 指定箭头头部:
h = Graphics3D[Line[{{-1, 1 / 2, 0}, {0, 0, 0}, {-1, -1 / 2, 0}, {-1, 1 / 2, 0}}]];{Graphics3D[{Arrowheads[{{-.1, 0, {h, 1}}, {.1, 1, {h, 1}}}], Arrow[{{0, 0, 0}, {2, 1, 1}}]}], Graphics3D[{Arrowheads[{{-.1, 0, {h, 1}}, {.1, 1, {h, 1}}}], Arrow[BSplineCurve[{{0, 0, 0}, {.5, 1, 1}, {2, 1, 1}}]]}]}坐标规范 (3)
用 Scaled 坐标:
Graphics[Arrow[{Scaled[{0, .2}], Scaled[{1, .8}]}], Frame -> True]Graphics3D[{Arrow[{Scaled[{0, .2, 0}], Scaled[{1, .8, 0.8}]}]}, Axes -> True]Graphics3D[{Arrow[Tube[{Scaled[{0, .2, 0}], Scaled[{1, .8, 0.8}]}]]}, Axes -> True]用 ImageScaled 坐标:
Graphics[Arrow[{ImageScaled[{0, .2}], ImageScaled[{1, .8}]}], Frame -> True]用 Offset 坐标:
Graphics[Arrow[{Offset[{10, 20}, {0, 0}], Offset[{-10, -20}, {1, 1}]}], Frame -> True]应用 (7)
Plot[Sin[x], {x, 0, 2Pi}, Epilog -> {Arrow[{{3Pi / 2, 1 / 2}, {Pi, 0}}], Text["Zero", {3Pi / 2, 1 / 2}, {-1, -1}]}]Show[Plot3D[Sin[x]Sin[y], {x, 0, 2Pi}, {y, 0, 2Pi}, Mesh -> None, PlotRange -> {-1, 4}, BoxRatios -> Automatic], Graphics3D[{Arrow[{{Pi, Pi, 4}, {Pi / 2, Pi / 2, 1}}], Arrow[{{Pi, Pi, 4}, {3Pi / 2, 3Pi / 2, 1}}], Text[Panel["Maximum", FrameMargins -> 0], {Pi, Pi, 4}]}]]With[{f = {v, u} / 5 - 1}, Graphics[Table[Arrow[{{u, v}, f + {u, v}}], {u, 0, 10}, {v, 0, 10}]]]With[{f = {v, u, 0} / 5 - 1}, Graphics3D[Table[Arrow[{{u, v, 0}, f + {u, v, 0}}], {u, 0, 10}, {v, 0, 10}]]]With[{f = {v, u, 0} / 5 - 1}, Graphics3D[Table[Arrow[Tube[{{u, v, 0}, f + {u, v, 0}}]], {u, 0, 10}, {v, 0, 10}]]]VectorPlot 和 VectorPlot3D 使用 Arrow:
VectorPlot[{x, -y}, {x, -3, 3}, {y, -3, 3}, VectorColorFunction -> "Rainbow"]VectorPlot3D[{x, y - 2 x, z - x}, {x, -3, 3}, {y, -3, 3}, {z, -3, 3}, VectorColorFunction -> "Rainbow", VectorMarkers -> "Arrow"]将 Arrow 用作 GraphPlot 的 EdgeRenderingFunction:
GraphPlot[Table[i -> Mod[i + 1, 6], {i, 0, 5}], EdgeShapeFunction -> (Arrow[#1]&), PlotStyle -> Arrowheads[Medium]]PolyhedronData["Dodecahedron", "Skeleton", "Rule"]GraphPlot3D[%, EdgeShapeFunction -> (Arrow[#1]&)]AnnotatedArrow[p_, q_, label_] := {Arrowheads[{{-.1, 0}, {.1, .5, Graphics[Inset[Style[label, Medium], {Center, Top}]]}, {.1, 1}}], Arrow[{p, q}]}Graphics[{AnnotatedArrow[{-1, 0}, {1, 0}, "diameter = 2"], Circle[]}]Graphics[{AnnotatedArrow[1 / Sqrt[2]{-1, -1}, 1 / Sqrt[2]{1, 1}, "*d* = 2"], Circle[]}]ParallelDim[p_, q_, offset_, label_] := {Arrowheads[{{-.1, 0}, {.1, 0, Graphics[Line[{{0, 1}, {0, -1}}]]}, {.1, .5, Graphics[Inset[Style[label, Medium], {Center, Top}]]}, {.1, 1, Graphics[Line[{{0, 1}, {0, -1}}]]}, {.1, 1}}], Arrow[{p + offset, q + offset}]}Graphics[{Thick, Line[{{0, 0}, {1, 1}, {1, 0}, {0, 0}}], Thin, ParallelDim[{0, 0}, {1, 1}, {-.1, .1}, Sqrt[2]]}]Graphics[{Arrowheads[{Table[{0.04, i}, {i, 0.04, 1, 0.05}], Table[{0.04, i}, {i, 0.04, 1, 0.2}]}], Arrow[JoinedCurve[{{Line[{{2, 3}, {0.8125, 0.625}}],
BezierCurve[{{0.6875, 0.375}, {0.375, 0.25}, {1.125, 0.25}}, SplineDegree -> 2], BezierCurve[{{0.8125, 0.375}, {0.9375, 0.625}}],
Line[{{1.3125, 1.375}, {2.4375, 1.375}, {2.8125, 0.625}}],
BezierCurve[{{2.9375, 0.375}, {2.625, 0.25}, {3.625, 0.25}}, SplineDegree -> 2], BezierCurve[{{3.3125, 0.375}, {3.1875, 0.625}}]},
{Line[{{1.875, 2.5}, {1.375, 1.5}, {2.375, 1.5}}]}}, CurveClosed -> True]]}]ListLinePlot[Table[{Sin[3t], Cos[5t]}, {t, 0, 2Pi, 2Pi / 50}], Axes -> False] /. Line[rest_] :> {Arrowheads[Table[0.05, {i, 0, 1, .02}]], Arrow[BSplineCurve@rest]}属性和关系 (1)
用 Arrowheads 设置坐标轴的样式:
Plot[x ^ 3, {x, -1, 1}, AxesStyle -> Arrowheads[{-0.05, 0.05}]]巧妙范例 (4)
Graphics[Table[{Hue[RandomReal[]], Arrow[RandomReal[1, {2, 2}]]}, {75}]]Graphics3D[Table[{Hue[RandomReal[]], Arrow[Tube[RandomReal[1, {2, 3}], Scaled[0.007]]]}, {50}]]Graphics[Table[{Hue[k / 40], Arrow[{{0, 0}, {Cos[2k Pi / 40], Sin[2k Pi / 40]}}]}, {k, 40}]]With[{f = {Cos[x] + Sin[x], Sin[x]}}, Graphics[Table[{Hue[t / (2Pi), 1, .8], Arrow[{f, Normalize[D[f, x]] + f}]} /. x -> t, {t, 0, 2Pi, .1}]]]tree = \!\(\*GraphicsBox[«2»]\);Graphics3D[{Arrowheads[{{.1, 1, tree}}, Appearance -> "Projected"], Arrow[{{0, 0, 0}, {0, -0, 0.001}}], Green, Cuboid[{-10, -10, -3}, {10, 10, -2.8}]}]相关指南
-
▪
- 图形对象 ▪
- 地图和制图 ▪
- 箭头和类似箭头的形式 ▪
- 组合图形 ▪
- Graphics Primitives Gallery ▪
- 符号图形语言
相关链接
文本
Wolfram Research (2007),Arrow,Wolfram 语言函数,https://reference.wolfram.com/language/ref/Arrow.html (更新于 2010 年).
CMS
Wolfram 语言. 2007. "Arrow." Wolfram 语言与系统参考资料中心. Wolfram Research. 最新版本 2010. https://reference.wolfram.com/language/ref/Arrow.html.
APA
Wolfram 语言. (2007). Arrow. Wolfram 语言与系统参考资料中心. 追溯自 https://reference.wolfram.com/language/ref/Arrow.html 年
BibTeX
@misc{reference.wolfram_2026_arrow, author="Wolfram Research", title="{Arrow}", year="2010", howpublished="\url{https://reference.wolfram.com/language/ref/Arrow.html}", note=[Accessed: 18-August-2026]}
BibLaTeX
@online{reference.wolfram_2026_arrow, organization={Wolfram Research}, title={Arrow}, year={2010}, url={https://reference.wolfram.com/language/ref/Arrow.html}, note=[Accessed: 18-August-2026]}