Blend
更多信息
- Blend 进行迭加颜色混合,作为相适宜的彩色光源或发光显示.
- 在 Blend[{col1,…,coln},{u1,…,un}] 中,ui 被标准化,使得和为1. »
- Blend[{col1,col2,…}] 混合所有 coli 的相等分数.
- 在 Blend[{image1,image2},x] 中,如果 image1 和 image2 为不同维度,则使用维度的线性内插值.
- Blend[{image,col},x] 将 image 的每个像素与颜色 col 混合.
- 在 Blend[{image1,col1,…,coln,image2},x] 中,coli 被解释为一个图像,其尺寸是取自 image1 和image2 维度之间的线性内插值.
范例
打开所有单元 关闭所有单元基本范例 (4)
Blend[{Red, Blue}, 1 / 3]Graphics[Table[{Blend[{Red, Blue}, x], Disk[{8x, 0}]}, {x, 0, 1, 1 / 8}]]Plot3D[Sin[x + y ^ 2], {x, -3, 3}, {y, -2, 2}, ColorFunction -> (Blend[{Yellow, Purple}, #3]&)]Blend[{[image], Magenta}]范围 (12)
颜色 (6)
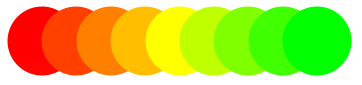
Blend[{Red, Green}]Graphics[{Blend[{Red, Green}], Disk[]}]Graphics[Table[{Blend[{Red, Green}, x], Disk[{8x, 0}]}, {x, 0, 1, 1 / 8}]]Blend[{RGBColor[1, 0, 0, 1], RGBColor[0, 1, 0, 0]}]Graphics[Table[{Blend[{RGBColor[1, 0, 0, 1], RGBColor[0, 1, 0, 0]}, x], Disk[{8x, 0}]}, {x, 0, 1, 1 / 8}]]Graphics[Table[{Blend[{Red, Yellow, Green}, x], Disk[{8x, 0}]}, {x, 0, 1, 1 / 8}]]Graphics[Table[{Blend[{{1, Red}, {3, Yellow}, {10, Green}}, x], Disk[{x, 0}]}, {x, 1, 10}]]Blend[{RGBColor[1, 0, 0], RGBColor[0, 1, 0], RGBColor[0, 0, 1]}]Blend[{RGBColor[1, 0, 0], RGBColor[0, 1, 0], RGBColor[0, 0, 1]}, {1 / 8, 1 / 2, 3 / 8}]ParametricPlot[{x, y}, {x, 0, 1}, {y, 0, 1 - x}, ColorFunction -> Function[{x, y}, Blend[{Red, Green, Blue}, {x, y, 1 - x - y}]]]图像 (6)
Blend[{[image], Yellow}]Blend[{[image], Yellow}, .2]Blend[{[image], [image]}]Blend[{[image], [image]}]Blend[{[image], [image]}]Blend[{\!\(\*Graphics3DBox[«8»]\), \!\(\*Graphics3DBox[«8»]\)}]应用 (2)
用 Blend,从基本色中构造一个 ColorFunction:
Plot[1 / x Sin[x ^ 2], {x, 0, 6}, ColorFunction -> (Blend[{LightBlue, Blue}, #2]&), PlotStyle -> Thick]Plot3D[ x y / (x ^ 2 + y ^ 2), {x, -2, 2}, {y, -2, 2}, RegionFunction -> Function[{x, y, z}, x^2 + y^2 > 0.1], ColorFunction -> (Blend[{Lighter[Yellow, .8], Orange, Red}, #3]&), Mesh -> None]ContourPlot3D[x ^ 2 + y ^ 2 - z ^ 4 + z ^ 5 == 0, {x, -1, 1}, {y, -1, 1}, {z, -1, 1}, ColorFunction -> (Blend[{Cyan, Magenta, Yellow}, {#1, #2, #3}]&), Mesh -> None, ContourStyle -> Opacity[0.7]]Blend[{[image], [image], [image], [image], [image]}]属性和关系 (7)
Blend[{Red, Green, Blue}, {1, 2, 3}]%//InputFormGraphics[Raster[{Range[100] / 100}, ColorFunction -> (Blend[{{0, Red}, {1, Green}, {2 / 3, Yellow}, {1 / 3, Blue}}, #]&)], AspectRatio -> .3]Column[Labeled[ArrayPlot[{Table[Blend[ColorConvert[{Blue, Red}, #], n], {n, 0, 1, .01}]}, AspectRatio -> .25], #]& /@ {RGBColor, Hue, XYZColor, LCHColor}]ArrayPlot[{Table[Blend[{Red, Hue[2 / 3]}, n], {n, 0, 1, .01}]}, AspectRatio -> .25]{Lighter[Blue, 1 / 3], Blend[{Blue, White}, 1 / 3]}{Darker[Blue, 1 / 3], Blend[{Blue, Black}, 1 / 3]}ColorData 包含大量称为 "Gradients" 的预定义 Blend 色.
ColorData["Gradients"]//ShortColorData["TemperatureMap", "Image"]DensityPlot[x, {x, 0, 1}, {y, 0, 1}, ColorFunction -> (ColorData["SunsetColors"][#]&)]DensityPlot[x, {x, 0, 1}, {y, 0, 1}, ColorFunction -> "SunsetColors"]Polygon 支持等比例的 VertexColors 混合:
Graphics[Polygon[{{0, 0}, {1, 0}, {0, 1}}, VertexColors -> {Blue, Red, Green}]]ParametricPlot[{x, y}, {x, 0, 1}, {y, 0, 1 - x}, ColorFunction -> Function[{x, y}, Blend[{Red, Green, Blue}, {x, y, 1 - x - y}]], Frame -> False, Axes -> False]可能存在的问题 (2)
Graphics[Table[{Blend[{Red, Green}, i], EdgeForm[Gray], Rectangle[{4i, 0}]}, {i, 0 - 1 / 4, 1 + 1 / 4, 1 / 4}]]在绘图函数中,用 ColorFunctionScaling 控制变量的整体比例:
Table[DensityPlot[x, {x, -2, 3}, {y, 0, 1}, FrameTicks -> None, ColorFunction -> (Blend[{Red, Green}, #]&), ColorFunctionScaling -> t], {t, {False, True}}]Graphics[Raster[{Range[100] / 100}, ColorFunction -> (Blend[{{0, Red}, {1 / 2, Yellow}, {1 / 2, Green}, {1, Blue}}, #]&)], AspectRatio -> .3]互动范例 (4)
Manipulate[Blend[{[image], [image]}, a], {a, 0, 1}]Manipulate[Blend[{[image], [image]}, a], {a, 0, 1}]Manipulate[Blend[Riffle[{[image], [image], [image]}, RGBColor[1, 1, 1]], a], {a, 0, 1}]Manipulate[Show[{ParametricPlot3D[List@@f[x], {x, 0, 1}, AxesLabel -> (Style[#, ToExpression@#]& /@ {"Red", "Green", "Blue"}), ColorFunction -> (RGBColor[#1, #2, #3]&), PlotStyle -> AbsoluteThickness[5]], Graphics3D[{f[u], AbsolutePointSize[20], Point[List@@f[u]]}]}], {u, 0, 1, Appearance -> "Labeled"}, Initialization :> (f[x_ ? NumericQ] := Blend[{Red, Blue, Yellow, Green}, x])]巧妙范例 (2)
在图中使用 Blend 得到复合纹理:
ArrayPlot[Table[Evaluate[Sum[Sin[RandomReal[5, 2].{x, y}], {10}]], {x, 0, 10, .05}, {y, 0, 10, .05}], ColorFunction -> (Blend[{Black, Red, Yellow, Black}, #]&)]ReliefPlot[Table[Evaluate[Sum[Sin[RandomReal[5, 2].{x, y}], {10}]], {x, 0, 10, .05}, {y, 0, 10, .05}], ColorFunction -> (Blend[{Darker[Green, .8], Lighter[Brown, .2], White}, #]&)]Graphics3D[Table[{Specularity[White, 100], Blend[{Red, Orange, Lighter[Gray, 1 / 3], Lighter[Blue, 2 / 3]}, i / 15], Sphere[{i Sin[2Pi i / 15], i Cos[2Pi i / 15], i}, i / 6]}, {i, 15}], Lighting -> "Neutral", ViewPoint -> Top, Boxed -> False, Background -> GrayLevel[.15]]文本
Wolfram Research (2007),Blend,Wolfram 语言函数,https://reference.wolfram.com/language/ref/Blend.html (更新于 2014 年).
CMS
Wolfram 语言. 2007. "Blend." Wolfram 语言与系统参考资料中心. Wolfram Research. 最新版本 2014. https://reference.wolfram.com/language/ref/Blend.html.
APA
Wolfram 语言. (2007). Blend. Wolfram 语言与系统参考资料中心. 追溯自 https://reference.wolfram.com/language/ref/Blend.html 年
BibTeX
@misc{reference.wolfram_2026_blend, author="Wolfram Research", title="{Blend}", year="2014", howpublished="\url{https://reference.wolfram.com/language/ref/Blend.html}", note=[Accessed: 15-September-2026]}
BibLaTeX
@online{reference.wolfram_2026_blend, organization={Wolfram Research}, title={Blend}, year={2014}, url={https://reference.wolfram.com/language/ref/Blend.html}, note=[Accessed: 15-September-2026]}