MatrixGamePlot[mgame]
generates a plot of the MatrixGame mgame.
MatrixGamePlot[mgame,strat]
highlight the game strategy strat.


MatrixGamePlot
MatrixGamePlot[mgame]
generates a plot of the MatrixGame mgame.
MatrixGamePlot[mgame,strat]
highlight the game strategy strat.
Details and Options


- MatrixGamePlot is typically used to communicate and understand a matrix game.
- In a two-player game, there is a matrix of payoff vectors. Each vector represents the payoff for each player.
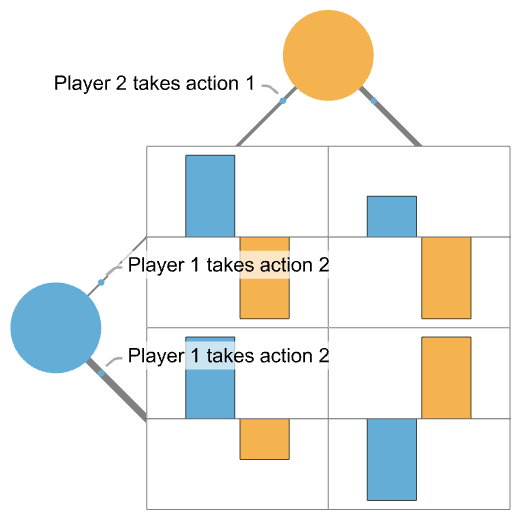
- The following is a plot of a two-player game where payoffs are plotted as charts and colored according to the player:
- Strategies may also be represented by the thickness of the line over each player row or column. The order of the player action is from top to bottom and from left to right:
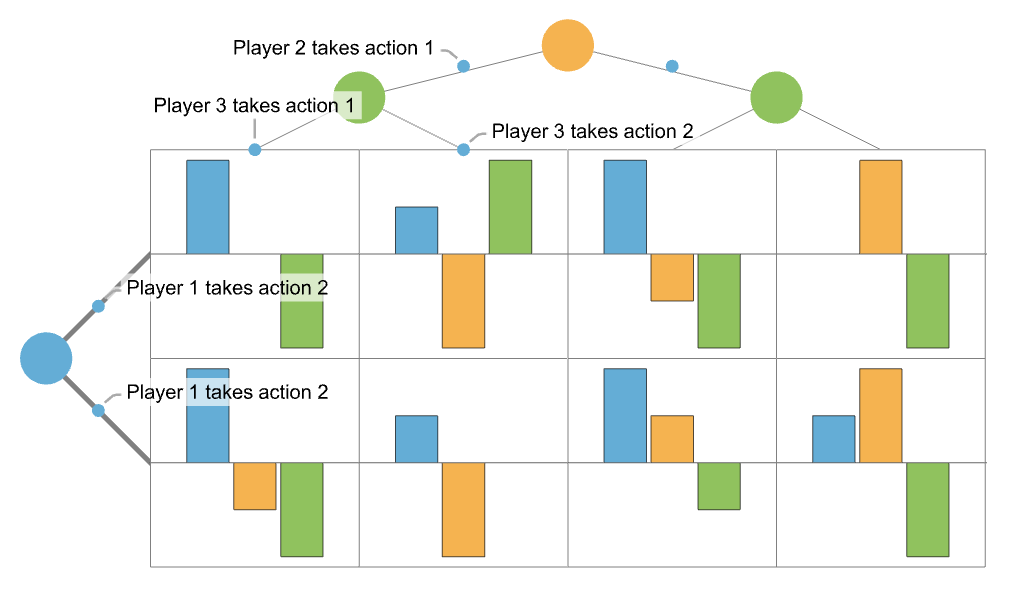
- When there are multiple players on rows or columns, a row or column is used for each combination for player actions:
- MatrixGamePlot has the same options as Graphics, with the following additions and changes: [List of all options]
-
ColorFunction Automatic how to color payoffs for each player ColorFunctionScaling False whether to scale arguments to ColorFunction GameActionLabels Automatic labels to use for actions GamePlayerLabels Automatic labels to use for players PlotLayout Automatic specifies the layout of squares and rows PlotLegends Automatic legends for payoff values - ColorData["DefaultPlotColors"] gives the default sequence of colors used by ColorFunction.
- Possible settings for PlotLayout are:
-

"BarChart" plot each payoff square as a BarChart 
"SplitSquare" plot each payoff square as a split square 
{{r1,…,rk},{c1,…,cn-k}} change the row players and column players 
{"SplitSquare",{{…},{…}}} combine the two previous options - Note that the payoff array may be reshaped to become a matrix with players {r1,…,rk} as row players and {c1,…,cn-k} as column players. For example, if there are five players, the default ordering may divide the first two players ({1,2}) on rows and the three other players ({3,4,5}) on columns. This order may be changed using this option.
-
AlignmentPoint Center the default point in the graphic to align with AspectRatio Automatic ratio of height to width Axes False whether to draw axes AxesLabel None axes labels AxesOrigin Automatic where axes should cross AxesStyle {} style specifications for the axes Background None background color for the plot BaselinePosition Automatic how to align with a surrounding text baseline BaseStyle {} base style specifications for the graphic ColorFunction Automatic how to color payoffs for each player ColorFunctionScaling False whether to scale arguments to ColorFunction ContentSelectable Automatic whether to allow contents to be selected CoordinatesToolOptions Automatic detailed behavior of the coordinates tool Epilog {} primitives rendered after the main plot FormatType TraditionalForm the default format type for text Frame False whether to put a frame around the plot FrameLabel None frame labels FrameStyle {} style specifications for the frame FrameTicks Automatic frame ticks FrameTicksStyle {} style specifications for frame ticks GameActionLabels Automatic labels to use for actions GamePlayerLabels Automatic labels to use for players GridLines None grid lines to draw GridLinesStyle {} style specifications for grid lines ImageMargins 0. the margins to leave around the graphic ImagePadding All what extra padding to allow for labels etc. ImageSize Automatic the absolute size at which to render the graphic LabelStyle {} style specifications for labels Method Automatic details of graphics methods to use PlotLabel None an overall label for the plot PlotLayout Automatic specifies the layout of squares and rows PlotLegends Automatic legends for payoff values PlotRange All range of values to include PlotRangeClipping False whether to clip at the plot range PlotRangePadding Automatic how much to pad the range of values PlotRegion Automatic the final display region to be filled PreserveImageOptions Automatic whether to preserve image options when displaying new versions of the same graphic Prolog {} primitives rendered before the main plot RotateLabel True whether to rotate y labels on the frame Ticks Automatic axes ticks TicksStyle {} style specifications for axes ticks


List of all options


Examples
open all close allBasic Examples (4)
Generate a two-player matrix game:
Generate the Prisoner's Dilemma:
Plot the game using split squares:
Show strategies using an array of the same dimensions as the GameActionLabels array:
Scope (5)
Two-Player Games (3)
Options (6)
ColorFunction (1)
Specify the color scheme used as seen in ColorData:
ColorFunctionScaling (1)
GameActionLabels (1)
PlotLayout (1)
Applications (9)
Recreational Games (2)
Rock-paper-scissors is a zero-sum game where either one player wins and the other loses or there is a tie. The plot style "SplitSquare" is best for two-player games:
This plot uses gray for the losing player (lowest value), a vibrant blue or orange for the winning player (highest value) and a pale orange or blue for a tie (average value).
Generalize Rock Paper Scissors to Rock Paper Scissors Fire Water by setting up dominance order using a graph:
Social Games (1)
The Volunteer's Dilemma describes a situation where each player can either volunteer or defect. If at least one player volunteers, all other players marginally benefit from defecting. If no player volunteers, all players have a very low payoff. Generate a Volunteer's Dilemma game with four players:
The best way to visualize most games of more than two players is using the default "BarChart" style. Plot the game:
However, in the "SplitSquare" style, it is not clear what happens to players based on their choices:
A better visualization can be given by isolating a player:
The difference between volunteering and defecting is marginal, except where all players defect.
Prisoner's Dilemma (2)
Consider a Prisoner's Dilemma game:
Consider that each player has a dominating strategy: to defect.
Naturally, the intersection of dominating strategies is a Nash equilibrium:
Consider an Optional Prisoner's Dilemma game:
Attempt to find the Nash equilibria:
As indicated, the number of solutions is infinite, thus requiring further analysis:
The player strategy {0,0,1} is not a dominating strategy, as one may verify:
However, the strategy {{0,0,1},{0,0,1}} is a Nash equilibrium:
Economics Games (3)
Three hungry men go to the restaurant and decide to split the bill evenly before ordering. There are three meal options, Cheap, Mediocre and Expensive. Represent this situation as a MatrixGame:
The Cournot Oligopoly game describes a situation where a group of firms produces the same good. Each firm must consider the production cost and the quantity the other firms are producing. Only the firms with the lowest price sell goods.
Generate a Cournot Oligopoly game:
Find the optimal game strategies in this game:
This is intuitive when considering for all players, the payoffs are largest for the second action:
A price war refers a game where multiple firms have an interest in offering the lowest price, but the payoff of any firm is directly correlated to the price chosen. Consider a price war among three firms, where each firm has the choice between a low price and a high price:
Despite the common interest of having the price as high as possible, competition creates a Nash equilibrium at the low price:
Symmetry in Games (1)
An easy way to visualize the symmetry or differences between player payoffs is to plot them using different row and column players. For example, consider the difference between pure coordination and dangerous coordination games. In the former, players have the same payoffs:
If a game is symmetric over players, then any permutation that maintains the shape of the plot should show equivalent payoffs:
Related Guides
History
Text
Wolfram Research (2025), MatrixGamePlot, Wolfram Language function, https://reference.wolfram.com/language/ref/MatrixGamePlot.html.
CMS
Wolfram Language. 2025. "MatrixGamePlot." Wolfram Language & System Documentation Center. Wolfram Research. https://reference.wolfram.com/language/ref/MatrixGamePlot.html.
APA
Wolfram Language. (2025). MatrixGamePlot. Wolfram Language & System Documentation Center. Retrieved from https://reference.wolfram.com/language/ref/MatrixGamePlot.html
BibTeX
@misc{reference.wolfram_2025_matrixgameplot, author="Wolfram Research", title="{MatrixGamePlot}", year="2025", howpublished="\url{https://reference.wolfram.com/language/ref/MatrixGamePlot.html}", note=[Accessed: 06-January-2026]}
BibLaTeX
@online{reference.wolfram_2025_matrixgameplot, organization={Wolfram Research}, title={MatrixGamePlot}, year={2025}, url={https://reference.wolfram.com/language/ref/MatrixGamePlot.html}, note=[Accessed: 06-January-2026]}