"Spectral" (Machine Learning Method)
- Method for FindClusters, ClusterClassify and ClusteringComponents.
- Partitions data into clusters of similar elements using a "Spectral" method.
Details & Suboptions
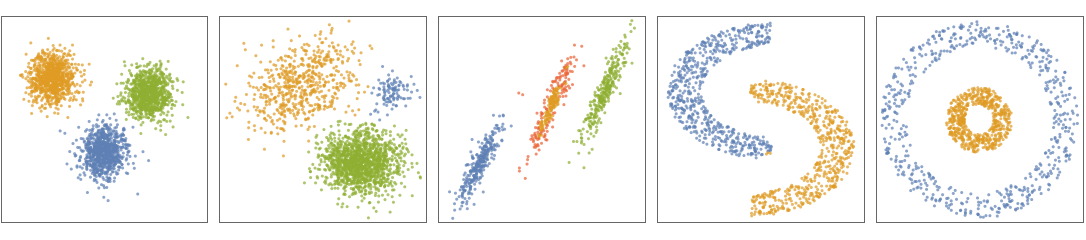
- "Spectral" is a hybrid neighbor-based/centroid-based clustering method. "Spectral" works for arbitrary cluster shapes but requires clusters to have similar sizes. Since the method solves an eigenvalue problem, it is computationally expensive for large datasets.
- The following plots show the results of the "Spectral" method applied to toy datasets:
- To identify k clusters, the "Spectral" method uses the "KMeans" algorithm after reducing the data to k-dimensions. The dimensionality reduction is a neighbor-based nonlinear method similar to "Isomap": The adjacency matrix,
![A_(ij)=Exp[-d^2_(ij)/2sigma^2]](Files/Spectral.en/2.png "A_(ij)=Exp[-d^2_(ij)/2sigma^2]") is computed for every data point i, j.
is computed for every data point i, j.  is the distance between the points, and
  is a scale parameter.
  is then centered, normalized and linearly reduced to dimension k. Mathematically speaking, the centered and renormalized adjacency matrix is given by
  , where
  is the diagonal matrix defined as
  . The largest k eigenvectors of
  constitute the reduced data.
 - The option DistanceFunction can be used to define
 .
. - The following suboption can be given:
-
"NeighborhoodRadius" Automatic value for scale parameter 
Examples
open all close allBasic Examples (3)
Find clusters of numbers using the "Spectral" method:
FindClusters[{1, 2, 10, 12, 3, 1, 13, 25}, Method -> "Spectral"]Find up to four clusters using the "Spectral" method:
FindClusters[{1, 2, 10, 12, 3, 1, 13, 25}, UpTo[4], Method -> "Spectral"]Train the ClassifierFunction on a list of colors using the "Spectral" method:
SeedRandom[123];
colors = RandomColor[70];
c = ClusterClassify[colors, Method -> "Spectral"]
Gather the elements by their class number:
GatherBy[colors, c]Create and visualize noisy 2D moon-shaped training and test datasets:
circle[r_, theta_] := {r Sin[theta], r Cos[theta]};
SeedRandom[123];
{train, test} = With[{
	rot = RotationTransform[π, {0, 0}],
	tra = TranslationTransform[{1, 2.5}], pts = circle@@@RandomVariate[UniformDistribution[{{2, 3}, {0, Pi}}], 2000]},
	TakeDrop[RandomSample@Join[tra[rot[pts]], pts], 2000]
	];
ListPlot[{train, test}, PlotRange -> All, AspectRatio -> 1, PlotStyle -> Directive[ PointSize[0.013], Opacity[0.7]], Frame -> True, Axes -> False]
Train a ClassifierFunction using the "Spectral" method; find and visualize clusters in the test set:
ncls = 2;
cl = ClusterClassify[train, UpTo[ncls], Method -> "Spectral"]
decision = cl[test];
ListPlot[Pick[test, decision, #]& /@ Range[ncls], PlotStyle -> Directive[PointSize[0.025], Opacity[0.7]], AspectRatio -> 1, Frame -> True, Axes -> False]
Scope (2)
Perform cluster analysis of a computed tomography scan image using the "Spectral" method:
Colorize[ClusteringComponents[[image] , Method -> "Spectral"]]Create a ClassifierFunction from a list of images and classify examples using the "Spectral" method:
flowers = {[image], [image], [image], [image], [image], [image], [image], [image], [image], [image], [image], [image], [image], [image], [image], [image], [image], [image], [image]};c = ClusterClassify[flowers, UpTo[3], Method -> "Spectral"]Find the cluster assignments and gather the elements by their corresponding clusters:
c[flowers]GatherBy[flowers, c]Options (3)
DistanceFunction (1)
Find two clusters in data using Manhattan distance:
FindClusters[{{2, 3}, {5, 10}, {4, 5}, {2, 2}, {5, 5}, {6, 4}}, UpTo[2], Method -> "Spectral", DistanceFunction -> ManhattanDistance]Define a set of two-dimensional data points, characterized by four somewhat nebulous clusters:
dn1 = MultinormalDistribution[{3, 3}, {{2, 1 / 3}, {1 / 3, 2 / 3}}];
dn2 = MultinormalDistribution[{-3, -3}, {{2, -1 / 3}, {-1 / 3, 2 / 3}}];
dn3 = MultinormalDistribution[{3, -4}, {{2, -1 / 3}, {-1 / 3, 2 / 3}}];
dn4 = MultinormalDistribution[{-3, 4}, {{2, -1 / 3}, {-1 / 3, 2 / 3}}];
data = RandomVariate[MixtureDistribution[{1, 1, 1, 1}, {dn1, dn2, dn3, dn4}], 400];
Plot clusters in data using Manhattan distance:
ListPlot[FindClusters[data, Method -> "Spectral", DistanceFunction -> ManhattanDistance]]"NeighborhoodRadius" (2)
Find clusters by specifying the "NeighborhoodRadius" suboption:
FindClusters[{1, 2, 10, 12, 3, 1, 13, 25, 100}, Method -> {"Spectral", "NeighborhoodRadius" -> .1}]Generate two moon-shaped datasets and visualize them:
circle[r_, theta_] := {r Sin[theta], r Cos[theta]};
points  = RandomVariate[MixtureDistribution[{1, 1},
	{
	UniformDistribution[{{2, 2.5}, {0,    Pi}}], UniformDistribution[{{3, 4}, {Pi,    2Pi}}]
	}
	],
	  1000];
data = circle@@@points;
ListPlot[data, PlotRange -> All]
Plot different clusterings of data using the "Spectral" method by varying the "NeighborhoodRadius":
table = Table[ListPlot[FindClusters[data, Method -> {"Spectral", "NeighborhoodRadius" -> p}]], {p, {0.05, 0.1, 0.2, 0.4}}]