Make a Grid of Output Data
Using Dataset...
Dataset gives a quick, left-aligned view of tabular data in an array:
Dataset[{{"breadbox", 8, 8, 15}, {"brick", 2, 4, 8}, {"cereal box", 2, 10, 14}, {"marble", 1, 1, 1}, {"egg", 2, 2, 3}}]When the data is a list of associations, Dataset displays the association keys as column headings:
Dataset[{<|"name" -> "breadbox", "w" -> 8, "l" -> 8, "h" -> 15|>, <|"name" -> "brick", "w" -> 2, "l" -> 4, "h" -> 8|>, <|"name" -> "cereal box", "w" -> 2, "l" -> 10, "h" -> 14|>, <|"name" -> "marble", "w" -> 1, "l" -> 1, "h" -> 1|>, <|"name" -> "egg", "w" -> 2, "l" -> 2, "h" -> 3|>}]Using Grid...
For detailed control of formatting, use Grid.
Start with some data
Here is data on objects and their dimensions:
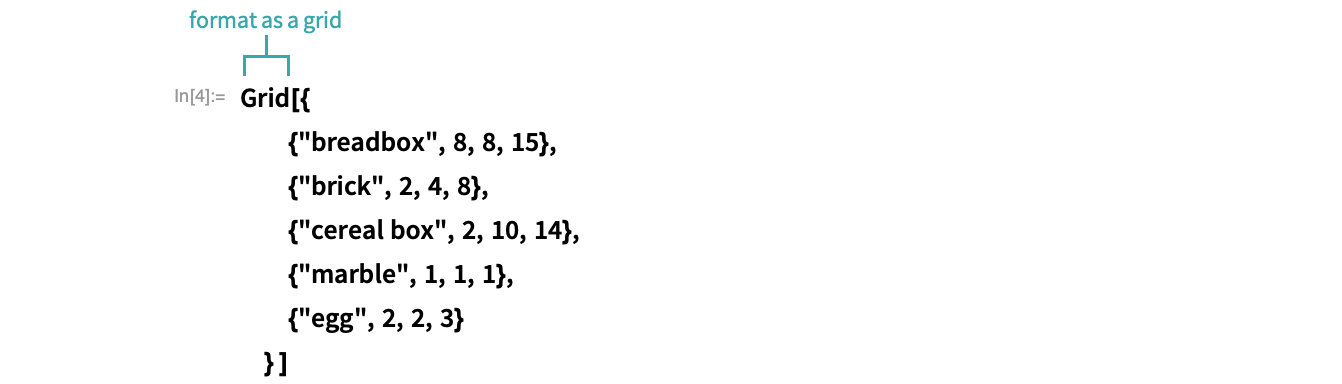
{{"breadbox", 8, 8, 15}, {"brick", 2, 4, 8}, {"cereal box", 2, 10, 14}, {"marble", 1, 1, 1}, {"egg", 2, 2, 3}}Format the data as a grid
Make a grid of the data:
Specify how the data in the grid should align
Use the Alignment option to specify how items in columns should align:

Add grid lines
Add grid lines with the Frame option:

Add column headings
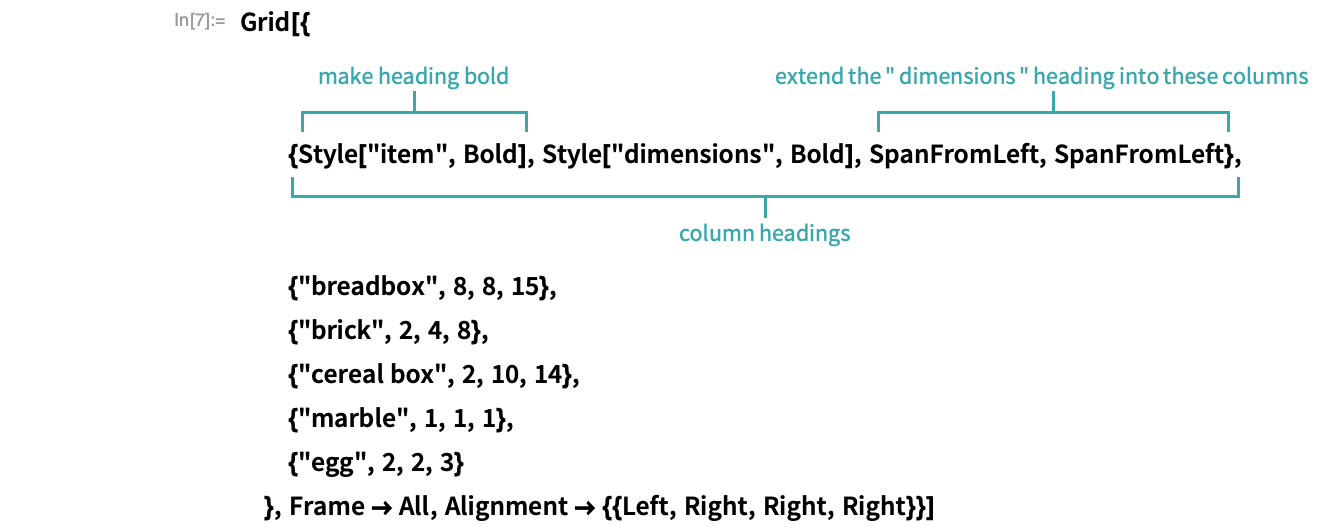
Add a row of column headings to the grid. Make the headings bold and extend the second heading into the third and fourth columns with SpanFromLeft:
Add row headings
Add a column of row headings to the grid. Make the headings bold, rotate them so that they are vertical and extend them across multiple rows with SpanFromAbove:
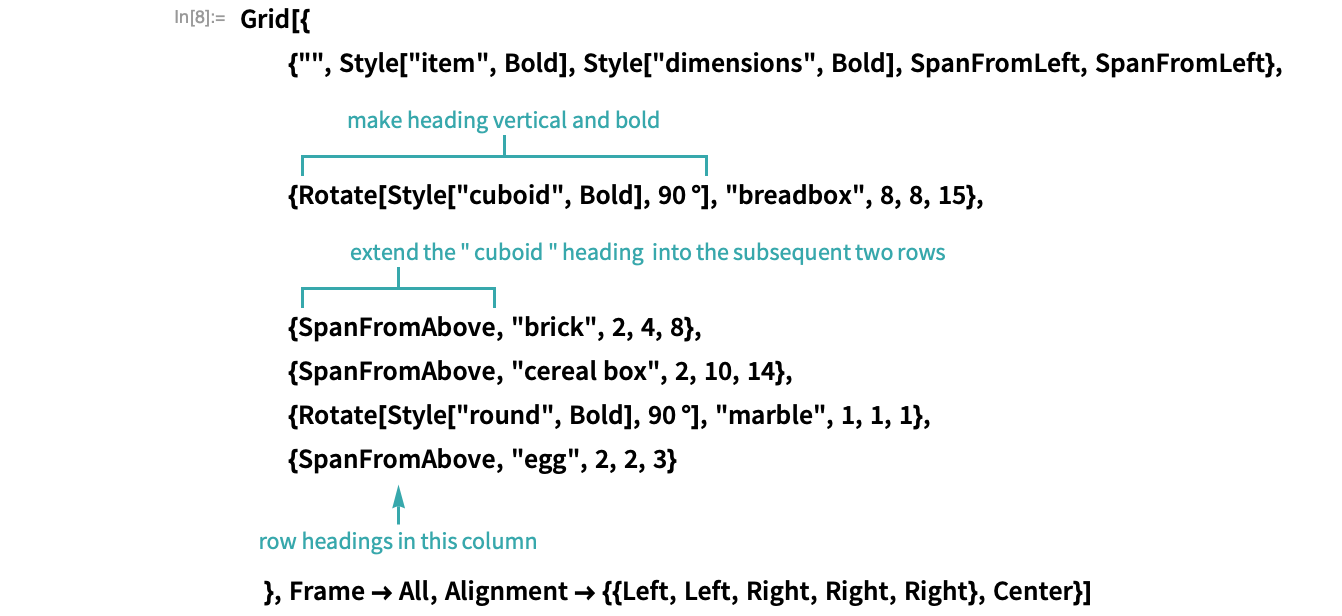
- Type the Degree symbol as
 deg
deg .
.
Using TableForm...
TableForm is a simple alternative to Grid.
Start with some data
Here is data on objects and their dimensions:
{{"breadbox", 8, 8, 15}, {"brick", 2, 4, 8}, {"cereal box", 2, 10, 14}, {"marble", 1, 1, 1}, {"egg", 2, 2, 3}}Format the data as a grid
Make a grid of the data:

Specify how the data in the grid should align
Use the TableAlignments option to specify how items in columns should align:

Add column headings
Add a row of column headings to the grid:

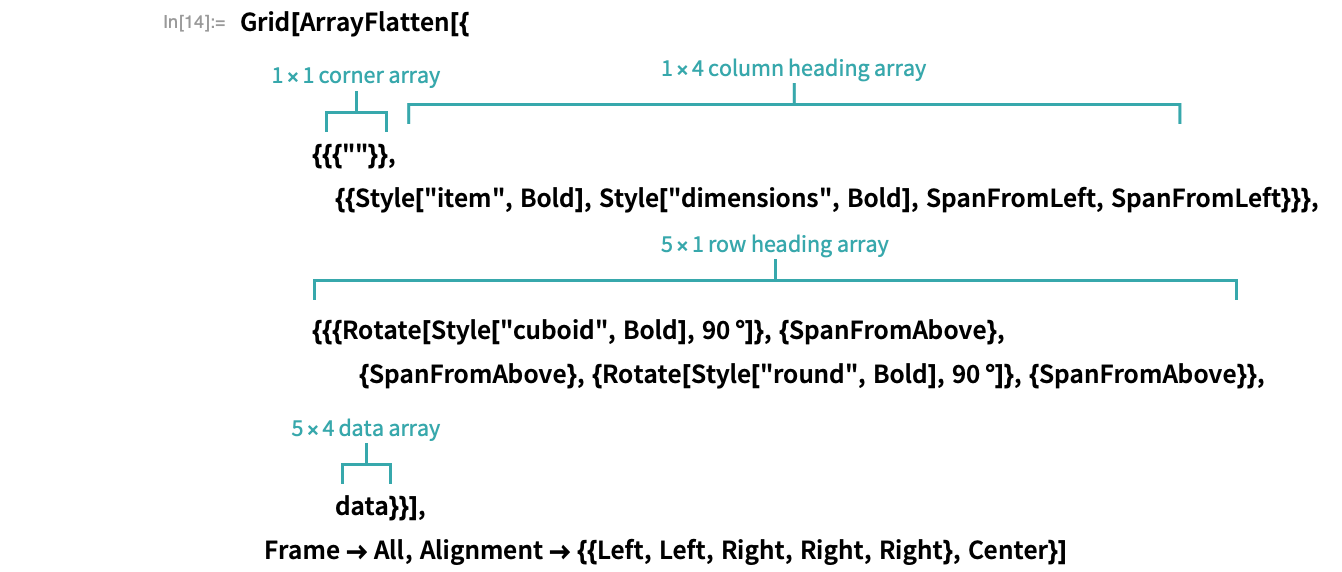
You can add column and row headings to the contents of a Grid programmatically using ArrayFlatten: