


ListSurfacePlot3D
ListSurfacePlot3D[{{x1,y1,z1},{x2,y2,z2},…}]
plots a three-dimensional surface constructed to fit the specified points.
Details and Options
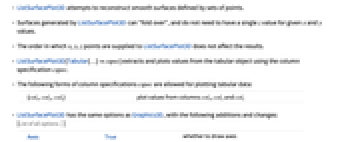
- ListSurfacePlot3D attempts to reconstruct smooth surfaces defined by sets of points.
- Surfaces generated by ListSurfacePlot3D can "fold over", and do not need to have a single
 value for given
  and
and  values.
 - The order in which
 ,
,  ,
,  points are supplied to ListSurfacePlot3D does not affect the results.
 - ListSurfacePlot3D[Tabular[…]cspec] extracts and plots values from the tabular object using the column specification cspec.
- The following forms of column specifications cspec are allowed for plotting tabular data:
-
{colx,coly,colz} plot values from columns colx, coly and colz - ListSurfacePlot3D has the same options as Graphics3D, with the following additions and changes: [List of all options]
-
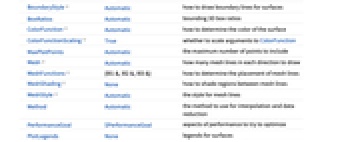
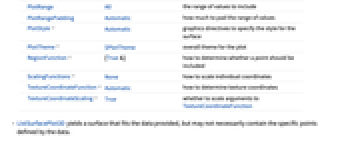
Axes True whether to draw axes BoundaryStyle Automatic how to draw boundary lines for surfaces BoxRatios Automatic bounding 3D box ratios ColorFunction Automatic how to determine the color of the surface ColorFunctionScaling True whether to scale arguments to ColorFunction MaxPlotPoints Automatic the maximum number of points to include Mesh Automatic how many mesh lines in each direction to draw MeshFunctions {#1&,#2&,#3&} how to determine the placement of mesh lines MeshShading None how to shade regions between mesh lines MeshStyle Automatic the style for mesh lines Method Automatic the method to use for interpolation and data reduction PerformanceGoal $PerformanceGoal aspects of performance to try to optimize PlotLegends None legends for surfaces PlotRange All the range of values to include PlotRangePadding Automatic how much to pad the range of values PlotStyle Automatic graphics directives to specify the style for the surface PlotTheme $PlotTheme overall theme for the plot RegionFunction (True&) how to determine whether a point should be included ScalingFunctions None how to scale individual coordinates TextureCoordinateFunction Automatic how to determine texture coordinates TextureCoordinateScaling True whether to scale arguments to TextureCoordinateFunction - ListSurfacePlot3D yields a surface that fits the data provided, but may not necessarily contain the specific points defined by the data.
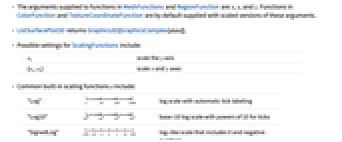
- The arguments supplied to functions in MeshFunctions and RegionFunction are x, y, and z. Functions in ColorFunction and TextureCoordinateFunction are by default supplied with scaled versions of these arguments.
- ListSurfacePlot3D returns Graphics3D[GraphicsComplex[data]].
- Possible settings for ScalingFunctions include:
-
sy scale the y axis {sx,sy} scale x and y axes - Common built-in scaling functions s include:
-
"Log" 
log scale with automatic tick labeling "Log10" 
base-10 log scale with powers of 10 for ticks "SignedLog" 
log-like scale that includes 0 and negative numbers "Reverse" 
reverse the coordinate direction "Infinite" 
infinite scale -
 Highlight options with settings specific to ListSurfacePlot3D
-
AlignmentPoint Center the default point in the graphic to align with AspectRatio Automatic ratio of height to width Axes True whether to draw axes AxesEdge Automatic on which edges to put axes AxesLabel None axes labels AxesOrigin Automatic where axes should cross AxesStyle {} graphics directives to specify the style for axes Background None background color for the plot BaselinePosition Automatic how to align with a surrounding text baseline BaseStyle {} base style specifications for the graphic BoundaryStyle Automatic how to draw boundary lines for surfaces Boxed True whether to draw the bounding box BoxRatios Automatic bounding 3D box ratios BoxStyle {} style specifications for the box ClipPlanes None clipping planes ClipPlanesStyle Automatic style specifications for clipping planes ColorFunction Automatic how to determine the color of the surface ColorFunctionScaling True whether to scale arguments to ColorFunction ContentSelectable Automatic whether to allow contents to be selected ControllerLinking False when to link to external rotation controllers ControllerPath Automatic what external controllers to try to use Epilog {} 2D graphics primitives to be rendered after the main plot FaceGrids None grid lines to draw on the bounding box FaceGridsStyle {} style specifications for face grids FormatType TraditionalForm default format type for text ImageMargins 0. the margins to leave around the graphic ImagePadding All what extra padding to allow for labels, etc. ImageSize Automatic absolute size at which to render the graphic LabelStyle {} style specifications for labels Lighting Automatic simulated light sources to use MaxPlotPoints Automatic the maximum number of points to include Mesh Automatic how many mesh lines in each direction to draw MeshFunctions {#1&,#2&,#3&} how to determine the placement of mesh lines MeshShading None how to shade regions between mesh lines MeshStyle Automatic the style for mesh lines Method Automatic the method to use for interpolation and data reduction PerformanceGoal $PerformanceGoal aspects of performance to try to optimize PlotLabel None a label for the plot PlotLegends None legends for surfaces PlotRange All the range of values to include PlotRangePadding Automatic how much to pad the range of values PlotRegion Automatic final display region to be filled PlotStyle Automatic graphics directives to specify the style for the surface PlotTheme $PlotTheme overall theme for the plot PreserveImageOptions Automatic whether to preserve image options when displaying new versions of the same graphic Prolog {} 2D graphics primitives to be rendered before the main plot RegionFunction (True&) how to determine whether a point should be included RotationAction "Fit" how to render after interactive rotation ScalingFunctions None how to scale individual coordinates SphericalRegion Automatic whether to make the circumscribing sphere fit in the final display area TextureCoordinateFunction Automatic how to determine texture coordinates TextureCoordinateScaling True whether to scale arguments to TextureCoordinateFunction Ticks Automatic specification for ticks TicksStyle {} style specification for ticks TouchscreenAutoZoom False whether to zoom to fullscreen when activated on a touchscreen ViewAngle Automatic angle of the field of view ViewCenter Automatic point to display at the center ViewMatrix Automatic explicit transformation matrix ViewPoint {1.3,-2.4,2.} viewing position ViewProjection Automatic projection method for rendering objects distant from the viewer ViewRange All range of viewing distances to include ViewVector Automatic position and direction of a simulated camera ViewVertical {0,0,1} direction to make vertical
List of all options
Examples
open all close allScope (13)
Data (4)
Use MaxPlotPoints to limit the number of points used:
Use PlotRange to focus in on areas of interest:
Use RegionFunction to restrict the surface to a region given by inequalities:
Tabular Data (1)
Presentation (8)
Provide an explicit PlotStyle for the surface:
Style the areas between mesh lines:
Use a theme with a dark background and grid lines:
Use a theme with minimum styling:
Use ScalingFunctions to flip the x axis:
Options (70)
Axes (3)
AxesLabel (4)
AxesOrigin (2)
AxesStyle (4)
BoundaryStyle (4)
Use a black boundary around the edges of the surface:
Use a thick boundary around the edges of the surface:
Use a thick red boundary around the edges of the surface:
BoundaryStyle applies to holes cut by RegionFunction:
ColorFunction (4)
Color by scaled ![]() ,
, ![]() , and
, and ![]() values:
values:
Named color gradients color in the ![]() direction:
direction:
ColorFunction has higher priority than PlotStyle:
ColorFunction has lower priority than MeshShading:
ImageSize (7)
Use named sizes such as Tiny, Small, Medium and Large:
Specify the width of the plot:
Specify the height of the plot:
Allow the width and height to be up to a certain size:
Specify the width and height for a graphic, padding with space if necessary:
Setting AspectRatioFull will fill the available space:
Use maximum sizes for the width and height:
Use ImageSizeFull to fill the available space in an object:
Specify the image size as a fraction of the available space:
Mesh (5)
MeshFunctions (2)
MeshShading (4)
Use None to remove regions:
Lay a checkerboard pattern over a surface:
MeshShading has a higher priority than PlotStyle:
MeshShading has a higher priority than ColorFunction:
MeshStyle (2)
PlotStyle (6)
Color a surface with diffuse cyan:
Use Specularity to get highlights:
Use Opacity to get transparent surfaces:
ColorFunction has higher priority than PlotStyle:
MeshShading has a higher priority than PlotStyle:
ScalingFunctions (4)
By default, plots have linear scales in all directions:
Log-scaled plots will only plot regions in which Log is defined:
Use a shifted log scale to show a function with negative values:
Use ScalingFunctions to reverse the coordinate direction in the ![]() direction:
direction:
TextureCoordinateFunction (4)
Ticks (6)
Ticks are placed automatically in each plot:
Use TicksNone to not draw any tick marks:
Place tick marks at specific positions:
Draw tick marks at the specified positions with the specified labels:
Specify tick marks with scaled lengths:
Customize each tick with position, length, labeling and styling:
Properties & Relations (13)
ListPlot3D always assumes a function surface with one sheet:
ListSurfacePlot3D can fill in any number of sheets:
ListSurfacePlot3D produces an approximating general surface:
ListPlot3D constructs a function surface that oscillates rapidly in the ![]() direction:
direction:
When using multiple ![]() values for each
values for each ![]() ,
, ![]() value, the duplicates are discarded by ListPlot3D:
value, the duplicates are discarded by ListPlot3D:
ListSurfacePlot3D still reconstructs the general surface:
Use ListPointPlot3D to show three-dimensional points:
Use ListContourPlot3D to find contours through values associated with ![]() ,
, ![]() ,
, ![]() data:
data:
Use ListContourPlot to create contours from continuous data:
Use ListDensityPlot to create densities from continuous data:
Use ArrayPlot for arrays of discrete data:
Use MatrixPlot for structural plots of matrices:
Use ReliefPlot for matrices corresponding to medical and geographic values:
Use ListLogPlot, ListLogLogPlot, and ListLogLinearPlot for logarithmic plots:
Use ListPolarPlot for polar plots:
Use DateListPlot to show data over time:
Use ParametricPlot3D for three-dimensional parametric curves and surfaces:
Text
Wolfram Research (2007), ListSurfacePlot3D, Wolfram Language function, https://reference.wolfram.com/language/ref/ListSurfacePlot3D.html (updated 2025).
CMS
Wolfram Language. 2007. "ListSurfacePlot3D." Wolfram Language & System Documentation Center. Wolfram Research. Last Modified 2025. https://reference.wolfram.com/language/ref/ListSurfacePlot3D.html.
APA
Wolfram Language. (2007). ListSurfacePlot3D. Wolfram Language & System Documentation Center. Retrieved from https://reference.wolfram.com/language/ref/ListSurfacePlot3D.html