

RiceDistribution
RiceDistribution[α,β]
represents a Rice distribution with shape parameters α and β.
RiceDistribution[m,α,β]
represents a Norton–Rice distribution with parameters m, α, and β.
Details
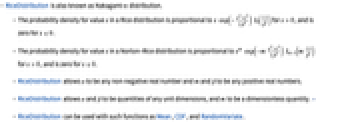
- RiceDistribution is also known as Nakagami-
 distribution.
 - The probability density for value
 in a Rice distribution is proportional to
 ![x exp(-(alpha^2+x^2)/(2 beta^2)) TemplateBox[{0, {{(, {x, , alpha}, )}, /, {(, {beta, ^, 2}, )}}}, BesselI]](Files/RiceDistribution.en/3.png "x exp(-(alpha^2+x^2)/(2 beta^2)) TemplateBox[{0, {{(, {x, , alpha}, )}, /, {(, {beta, ^, 2}, )}}}, BesselI]") for
for  , and is zero for
  .
. - The probability density for value
 in a Norton–Rice distribution is proportional to
 ![x^m exp(-m(alpha^2+x^2)/(2 beta^2)) TemplateBox[{{m, -, 1}, {m, {{(, {x, , alpha}, )}, /, {(, {beta, ^, 2}, )}}}}, BesselI]](Files/RiceDistribution.en/7.png "x^m exp(-m(alpha^2+x^2)/(2 beta^2)) TemplateBox[{{m, -, 1}, {m, {{(, {x, , alpha}, )}, /, {(, {beta, ^, 2}, )}}}}, BesselI]") for
for  , and is zero for
  .
. - RiceDistribution allows α to be any non-negative real number and m and β to be any positive real numbers.
- RiceDistribution allows α and β to be quantities of any unit dimensions, and m to be a dimensionless quantity. »
- RiceDistribution can be used with such functions as Mean, CDF, and RandomVariate.
Background & Context
- RiceDistribution[m,α,β] represents a continuous statistical distribution supported on the interval
 and parametrized by positive real numbers α and β (called "shape parameters") and by a non-negative real number m that together determine the overall behavior of its probability density function (PDF). In general, the PDF of a Rice distribution is unimodal with a single "peak" (i.e. a global maximum), though its overall shape (its height, its spread, and the horizontal location of its maximum) is determined by the values of α, β, and m. In addition, the tails of the PDF are "thin" in the sense that the PDF decreases exponentially rather than algebraically for large values of
  . (This behavior can be made quantitatively precise by analyzing the SurvivalFunction of the distribution.) The three-parameter form RiceDistribution[m,α,β] is most often referred to as the Norton–Rice distribution, while the two-parameter form RiceDistribution[α,β] (which is equivalent to RiceDistribution[1,α,β]) is most often referred to as "the" Rice distribution. The Rice distribution may also be referred to as the Nakagami distribution (not to be confused with NakagamiDistribution) or as the Rician distribution.
 - The Rice distribution was discovered by its namesake, S. O. Rice, in the 1940s while he was establishing the mathematical theory of random noise, and is particularly used in the field of telecommunications as a tool for modeling topics concerned with normally derived and normal noise processes. Mathematically, the Rice distribution is the one that describes the norm of vectors
 in
in  provided that the components
  are normally distributed random variates, while for
  the distribution also models the amplitude of the sum of a constant vector and a so-called Rayleigh vector (that is, a vector whose elementary components have their phases uniformly distributed over the interval
  ). The Rice distribution is used to model so-called Rician fading, a stochastic model describing radio propagation anomalies caused by signal cancellations, as well as a number of unrelated phenomena across various fields, including ballistics, medicine, finance, and marketing.
 - RandomVariate can be used to give one or more machine- or arbitrary-precision (the latter via the WorkingPrecision option) pseudorandom variates from a Rice distribution. Distributed[x,RiceDistribution[m,α,β]], written more concisely as xRiceDistribution[m,α,β], can be used to assert that a random variable x is distributed according to a Rice distribution. Such an assertion can then be used in functions such as Probability, NProbability, Expectation, and NExpectation.
- The probability density and cumulative distribution functions for Rice distributions may be given using PDF[RiceDistribution[m,α,β],x] and CDF[RiceDistribution[m,α,β],x]. The mean, median, variance, raw moments, and central moments may be computed using Mean, Median, Variance, Moment, and CentralMoment, respectively.
- DistributionFitTest can be used to test if a given dataset is consistent with a Rice distribution, EstimatedDistribution to estimate a Rice parametric distribution from given data, and FindDistributionParameters to fit data to a Rice distribution. ProbabilityPlot can be used to generate a plot of the CDF of given data against the CDF of a symbolic Rice distribution, and QuantilePlot to generate a plot of the quantiles of given data against the quantiles of a symbolic Rice distribution.
- TransformedDistribution can be used to represent a transformed Rice distribution, CensoredDistribution to represent the distribution of values censored between upper and lower values, and TruncatedDistribution to represent the distribution of values truncated between upper and lower values. CopulaDistribution can be used to build higher-dimensional distributions that contain a Rice distribution, and ProductDistribution can be used to compute a joint distribution with independent component distributions involving Rice distributions.
- RiceDistribution is related to a number of other distributions. RiceDistribution is the distribution of the norm of two variables that are normally distributed and hence is related to NormalDistribution, BinormalDistribution, and MultinormalDistribution. RiceDistribution is a special case of BeckmannDistribution (the PDF of RiceDistribution[α,β] is precisely that of BeckmannDistribution[α/
 ,α/
,α/ ,β,β]), is a general case of RayleighDistribution (RayleighDistribution[β] has the same PDF as RiceDistribution[0,β]), and can be obtained as a transformation of NoncentralChiSquareDistribution. RiceDistribution is also closely related to ChiSquareDistribution, ChiDistribution, LogNormalDistribution, and NakagamiDistribution.
Examples
open all close allBasic Examples (6)
Scope (8)
Generate a sample of pseudorandom numbers from a Rice distribution:
Compare its histogram to the PDF:
Distribution parameters estimation:
Estimate the distribution parameters from sample data:
Compare a density histogram of the sample with the PDF of the estimated distribution:
Different moments with closed forms as functions of parameters:
Closed form for symbolic order:
Hazard function of Rice distribution:
Hazard function of Norton–Rice distribution:
Quantile function of Rice distribution:
Quantile function of Norton–Rice distribution:
Consistent use of Quantity in parameters yields QuantityDistribution:
Applications (3)
A vector has two components, which are normally distributed with the same nonzero mean ![]() and the same variance
and the same variance ![]() . Assuming
. Assuming ![]() and
and ![]() , find the distribution of the length of the vector:
, find the distribution of the length of the vector:
Plot the probability density function:
Find the average length of the vector:
Find the probability that the length is at least 4:
Simulate possible lengths for a sample of 30 vectors:
In the theory of fading channels, RiceDistribution is used to model fading amplitude in the situation when the signal is composed of one strong direct line of sight and many weaker random components. Find the distribution of instantaneous signal-to-noise ratio where ![]() ,
, ![]() is the energy per symbol, and
is the energy per symbol, and ![]() is the spectral density of white noise:
is the spectral density of white noise:
Find the moment-generating function (MGF):
Show ![]() is a scaled NoncentralChiSquareDistribution:
is a scaled NoncentralChiSquareDistribution:
Express the MGF in terms of the mean:
Consider vectors with normal components with mean 3 and standard deviation 1:
Properties & Relations (10)
Rice distribution is closed under scaling by a positive factor:
Relationships to other distributions:
Norton–Rice distribution simplifies to Rice distribution for ![]() :
:
Rice distribution is the distribution of the norm of two variables with NormalDistribution:
Rice distribution is related to BinormalDistribution:
Rice–Norton distribution is related to MultinormalDistribution:
Rice distribution is a special case of BeckmannDistribution:
RayleighDistribution is a special case of Rice distribution:
NoncentralChiSquareDistribution can be obtained from Rice distribution:
A limit of a Norton–Rice distribution is a NakagamiDistribution:
Text
Wolfram Research (2010), RiceDistribution, Wolfram Language function, https://reference.wolfram.com/language/ref/RiceDistribution.html (updated 2016).
CMS
Wolfram Language. 2010. "RiceDistribution." Wolfram Language & System Documentation Center. Wolfram Research. Last Modified 2016. https://reference.wolfram.com/language/ref/RiceDistribution.html.
APA
Wolfram Language. (2010). RiceDistribution. Wolfram Language & System Documentation Center. Retrieved from https://reference.wolfram.com/language/ref/RiceDistribution.html