GraphPlot functionality is now available in the newly added built-in Mathematica kernel functions GraphPlot and LayeredGraphPlot.
GraphPlot3D is now available as the newly added built-in Mathematica kernel function GraphPlot3D.
TreePlot is now available as the newly added built-in Mathematica kernel function TreePlot.
GraphDistance, PseudoDiameter, MaximalBipartiteMatching, MaximalIndependentVertexSet, MaximalIndependentEdgeSet, MinCut, StrongComponents, and VertexList are now available through the newly created Graph Utilities Package.
The EdgeStyleFunction option is now available as the newly added built-in Mathematica kernel option EdgeRenderingFunction.
The TreeSizeFunction option is now available as the newly added built-in Mathematica kernel option LayerSizeFunction.
The VertexCoordinates option is now available as the newly added built-in Mathematica kernel option VertexCoordinateRules.
The VertexStyleFunction option is now available as the newly added built-in Mathematica kernel option VertexRenderingFunction.
The RootPosition option is now available as the second argument to the built-in Mathematica kernel function TreePlot.
GraphPlot
Plot a graph specified by a rule list:
g = GraphPlot[{2 -> 1, 3 -> 1, 3 -> 2, 4 -> 1, 4 -> 2, 5 -> 1, 5 -> 2}]GraphPlot3D
GraphPlot3D[{2 -> 1, 3 -> 1, 3 -> 2, 4 -> 1, 4 -> 2, 5 -> 1, 5 -> 2}]TreePlot
g = Flatten[Table[{i -> 2 * i, i -> 2 * i + 1}, {i, 2 ^ 4 - 1}]]
TreePlot[g]
EdgeStyleFunction
Use EdgeShapeFunction to control the way edges are drawn:
GraphPlot[Table[1, {30}, {30}], EdgeShapeFunction -> None]Alternate ways to draw edges as arrows:
GraphPlot[{1 -> 2, 2 -> 3, 3 -> 4, 4 -> 5, 5 -> 6, 6 -> 7, 7 -> 8, 8 -> 1,
      1 -> 9, 2 -> 9, 3 -> 10, 4 -> 10, 6 -> 11, 5 -> 11, 7 -> 12, 8 -> 12},
EdgeShapeFunction -> (Arrow[#1] &)]GraphPlot[{1 -> 2, 2 -> 3, 3 -> 4, 4 -> 5, 5 -> 6, 6 -> 7, 7 -> 8, 8 -> 1,
1 -> 9, 2 -> 9, 3 -> 10, 4 -> 10, 6 -> 11, 5 -> 11, 7 -> 12, 8 -> 12},
DirectedEdges -> True]LayerSizeFunction
g = Flatten[Table[{i -> 2 * i, i -> 2 * i + 1}, {i, 2 ^ 4 - 1}]]
TreePlot[g]
This plots the same graph, but with the height of each level i proportional to 1/i2:
TreePlot[g, LayerSizeFunction -> (1 / # ^ 2 &)]VertexCoordinates
Use VertexCoordinates to specify explicit coordinates for vertices:
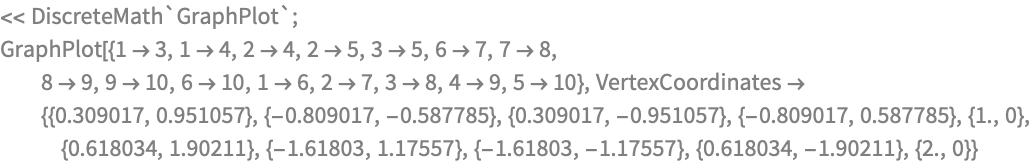
GraphPlot[{1 -> 3, 1 -> 4, 2 -> 4, 2 -> 5, 3 -> 5, 6 -> 7, 7 -> 8, 8 -> 9, 9 -> 10, 6 -> 10, 1 -> 6, 2 -> 7, 3 -> 8, 4 -> 9, 5 -> 10}, VertexCoordinates -> {{0.309017, 0.951057}, {-0.809017, -0.587785}, {0.309017, -0.951057}, {-0.809017, 0.587785}, {1., 0}, {0.618034, 1.90211}, {-1.61803, 1.17557}, {-1.61803, -1.17557}, {0.618034, -1.90211}, {2., 0}}]VertexStyleFunction
Use VertexShapeFunction to control the way vertices are drawn. This draws no vertices:
GraphPlot[{1 -> 2, 2 -> 3, 3 -> 4, 4 -> 5, 5 -> 6, 6 -> 1}, VertexShapeFunction -> None]This draws large blue vertices:
GraphPlot[{1 -> 2, 1 -> 3, 1 -> 4, 2 -> 3, 2 -> 4, 3 -> 5, 4 -> 6, 5 -> 7, 5 -> 8, 6 -> 7, 6 -> 8, 7 -> 8}, VertexShapeFunction -> ({Hue[.7], Disk[#, 0.05]} &)]RootPosition (Argument to TreePlot)
This plots the tree by placing the root to the left:
TreePlot[{1 -> 2, 2 -> 4, 3 -> 6, 4 -> 8, 5 -> 10, 6 -> 12, 1 -> 3, 2 -> 5, 3 -> 7, 4 -> 9, 5 -> 11, 6 -> 13}, Left]Many functions from DiscreteMath`GraphPlot` are now available as built-in Mathematica kernel functions.
This plots a graph of 37 vertices:
![<< DiscreteMath`GraphPlot`;
GraphPlot[\!\(\*
TagBox[
RowBox[{"g", "=",
RowBox[{"{",
RowBox[{
RowBox[{"1", "->", "2"}], ",",
RowBox[{"1", "->", "6"}], ",",
RowBox[{"1", "->", "7"}], ",",
RowBox[{"2", "->", "3"}], ",",
RowBox[{"2", "->", "7"}], ",",
RowBox[{"3", "->", "30"}], ",",
RowBox[{"3", "->", "26"}], ",",
RowBox[{"3", "->", "4"}], ",",
RowBox[{"3", "->", "32"}], ",",
RowBox[{"4", "->", "5"}], ",",
RowBox[{"4", "->", "9"}], ",",
RowBox[{"5", "->", "9"}], ",",
RowBox[{"5", "->", "10"}], ",",
RowBox[{"6", "->", "7"}], ",",
RowBox[{"6", "->", "11"}], ",",
RowBox[{"7", "->", "8"}], ",",
RowBox[{"7", "->", "30"}], ",",
RowBox[{"7", "->", "12"}], ",",
RowBox[{"8", "->", "9"}], ",",
RowBox[{"8", "->", "26"}], ",",
RowBox[{"8", "->", "13"}], ",",
RowBox[{"9", "->", "10"}], ",",
RowBox[{"9", "->", "32"}], ",",
RowBox[{"9", "->", "14"}], ",",
RowBox[{"10", "->", "15"}], ",",
RowBox[{"11", "->", "16"}], ",",
RowBox[{"11", "->", "27"}], ",",
RowBox[{"11", "->", "30"}], ",",
RowBox[{"11", "->", "35"}], ",",
RowBox[{"12", "->", "13"}], ",",
RowBox[{"12", "->", "17"}], ",",
RowBox[{"12", "->", "27"}], ",",
RowBox[{"13", "->", "31"}], ",",
RowBox[{"13", "->", "33"}], ",",
RowBox[{"13", "->", "14"}], ",",
RowBox[{"13", "->", "36"}], ",",
RowBox[{"13", "->", "18"}], ",",
RowBox[{"13", "->", "34"}], ",",
RowBox[{"14", "->", "28"}], ",",
RowBox[{"14", "->", "19"}], ",",
RowBox[{"15", "->", "32"}], ",",
RowBox[{"15", "->", "28"}], ",",
RowBox[{"15", "->", "37"}], ",",
RowBox[{"15", "->", "20"}], ",",
RowBox[{"16", "->", "17"}], ",",
RowBox[{"16", "->", "21"}], ",",
RowBox[{"17", "->", "21"}], ",",
RowBox[{"17", "->", "22"}], ",",
RowBox[{"17", "->", "35"}], ",",
RowBox[{"17", "->", "18"}], ",",
RowBox[{"18", "->", "19"}], ",",
RowBox[{"18", "->", "29"}], ",",
RowBox[{"19", "->", "37"}], ",",
RowBox[{"19", "->", "20"}], ",",
RowBox[{"19", "->", "24"}], ",",
RowBox[{"19", "->", "25"}], ",",
RowBox[{"20", "->", "25"}], ",",
RowBox[{"21", "->", "22"}], ",",
RowBox[{"22", "->", "23"}], ",",
RowBox[{"23", "->", "24"}], ",",
RowBox[{"23", "->", "29"}], ",",
RowBox[{"23", "->", "35"}], ",",
RowBox[{"23", "->", "37"}], ",",
RowBox[{"24", "->", "25"}], ",",
RowBox[{"30", "->", "31"}], ",",
RowBox[{"32", "->", "33"}], ",",
RowBox[{"34", "->", "35"}], ",",
RowBox[{"36", "->", "37"}]}], "}"}]}],
Short[#, 1000]& ]\), VertexStyleFunction -> Automatic];](Files/GraphPlot.en/legacy_12.gif)
GraphPlot[g = {1 -> 2, 1 -> 6, 1 -> 7, 2 -> 3, 2 -> 7, 3 -> 30, 3 -> 26, 3 -> 4, 3 -> 32, 4 -> 5, 4 -> 9, 5 -> 9, 5 -> 10, 6 -> 7, 6 -> 11, 7 -> 8, 7 -> 30, 7 -> 12, 8 -> 9, 8 -> 26, 8 -> 13, 9 -> 10, 9 -> 32, 9 -> 14, 10 -> 15, 11 -> 16, 11 -> 27, 11 -> 30, 11 -> 35, 12 -> 13, 12 -> 17, 12 -> 27, 13 -> 31, 13 -> 33, 13 -> 14, 13 -> 36, 13 -> 18, 13 -> 34, 14 -> 28, 14 -> 19, 15 -> 32, 15 -> 28, 15 -> 37, 15 -> 20, 16 -> 17, 16 -> 21, 17 -> 21, 17 -> 22, 17 -> 35, 17 -> 18, 18 -> 19, 18 -> 29, 19 -> 37, 19 -> 20, 19 -> 24, 19 -> 25, 20 -> 25, 21 -> 22, 22 -> 23, 23 -> 24, 23 -> 29, 23 -> 35, 23 -> 37, 24 -> 25, 30 -> 31, 32 -> 33, 34 -> 35, 36 -> 37}]This calculates the diameter of the graph:
ug = Join[g, Reverse /@ g];
GraphDiameter[ug]
This calculates the distance between vertices 1 and 25:
GraphDistance[ug, 1, 25]