AutocorrelationTest[data]
data が自己相関かどうかの検定を行う.
AutocorrelationTest[data,k]
data が自己相関かどうかの検定を遅れ k まで行う.
AutocorrelationTest[data,k,"property"]
指定されたモデルについての"property"の値を返す.
AutocorrelationTest
AutocorrelationTest[data]
data が自己相関かどうかの検定を行う.
AutocorrelationTest[data,k]
data が自己相関かどうかの検定を遅れ k まで行う.
AutocorrelationTest[data,k,"property"]
指定されたモデルについての"property"の値を返す.
詳細とオプション
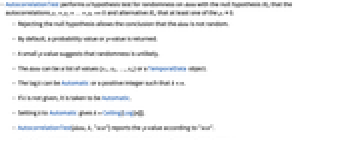
- AutocorrelationTestは,自己相関 ρ1=ρ2=…=ρk==0という帰無仮説
と,少なくとも1つが ρi≠0であるという対立仮説
で data についてのランダム性の仮説検定を行う. - 帰無仮説の棄却によって data がランダムではないという結果が可能になる.
- デフォルトで,確率値,すなわち
値が返される, - 小さい
値はランダム性が低いことを示している. - data は値のリスト{x1,x2,…,xn}あるいはTemporalDataオブジェクトである.
- 遅れ k は,Automaticあるいは k<n となるような正の整数である.
- k は,与えられていない場合はAutomaticであるとみなされる.
- k をAutomaticに設定すると k=Ceiling[Log[n]]が与えられる.
- AutocorrelationTest[data,k,"test"]は,"test"に従って
値をレポートする. - すべての経路の長さが等しく n である一変量データには,次の検定を使うことができる.
-
"LjungBox" 

"BoxPierce" 
- 多変量データには次の検定を使うことができる.
-
"LjungBox" 

"BoxPierce" ![n sum_(i=1)^kTr[TemplateBox[{{(, {gamma, _, i}, )}}, Transpose].TemplateBox[{{(, {gamma, _, 0}, )}}, Inverse].gamma_i.TemplateBox[{{(, {gamma, _, 0}, )}}, Inverse]] n sum_(i=1)^kTr[TemplateBox[{{(, {gamma, _, i}, )}}, Transpose].TemplateBox[{{(, {gamma, _, 0}, )}}, Inverse].gamma_i.TemplateBox[{{(, {gamma, _, 0}, )}}, Inverse]]](Files/AutocorrelationTest.ja/1.png)
- AutocorrelationTest[data,k,"HypothesisTestData"]はHypothesisTestDataオブジェクト htd を返す.このオブジェクトは,htd["property"] の形を使った追加的な検定結果と特性の抽出に使うことができる.
- AutocorrelationTest[data,k,"property"]を使って"property"の値を直接与えることができる.
- 検定結果のレポートに関連する特性
-
"AllTests" 適用可能なすべての検定のリスト "AutomaticTest" Automaticが使われた場合に選ばれる検定 "PValue"
値のリスト"PValueTable"
値のフォーマットされた表"ShortTestConclusion" 検定結果の簡単な記述 "TestConclusion" 検定結果の記述 "TestData" 検定統計と
値のペアのリスト"TestDataTable" 検定統計と
値のフォーマットされた表"TestStatistic" 検定統計のリスト "TestStatisticTable" 検定統計のフォーマットされた表 - 使用可能なオプション
-
SignificanceLevel 0.05 診断とレポートのための切捨て - 単位根の検定については,
のときにのみ
が拒絶されるような切捨て
が選ばれる."TestConclusion"特性と"ShortTestConclusion"特性に使われる
の値はSignificanceLevelオプションで制御される.デフォルトで,
は0.05に設定されている.
例題
すべて開く すべて閉じる例 (1)
スコープ (14)
検定 (10)
SeedRandom[135];
nac = RandomFunction[ARProcess[{}, 1], {1, 10000}];
ac = RandomFunction[ARProcess[{.1}, 1], {1, 10000}];AutocorrelationTest[nac]AutocorrelationTest[ac]SeedRandom[135];
data = RandomFunction[ARProcess[{}, {{1, 1 / 3}, {1 / 3, 2}}], {1, 10000}]data["ValueDimensions"]AutocorrelationTest[data]SeedRandom[324];
data = RandomFunction[SARIMAProcess[{.3}, 1, {.2}, {12, {.4}, 3, {.2}}, 1], {1, 10 ^ 2}];AutocorrelationTest[data, 5]遅れをAutomaticに設定することは,Ceiling[Log[n]]を使うことに等しい:
data = RandomVariate[NormalDistribution[], 100];AutocorrelationTest[data, Automatic]AutocorrelationTest[data, Ceiling[Log[Length[data]]]]data = TemporalData[TimeSeries, {{{-1.2593135604759231, -1.2337826909137528, -0.7638166378937818,
-1.4449728297725644, -1.9674559904020306, -2.8822228243276933, -3.3574235160922132,
-0.8140416418708107, 0.6215268695933782, -0.16597774939340448, ... 668776681318445, -15.857838034224033, -15.812986166672088, -16.091212276637293,
-15.747099928115142}}, {{1, 100, 1}}, 1, {"Continuous", 1}, {"Discrete", 1}, 1,
{ResamplingMethod -> {"Interpolation", InterpolationOrder -> 1}}}, False, 10.1];AutocorrelationTest[data, Automatic, "BoxPierce"]AutocorrelationTest[data, Automatic, {"BoxPierce", "LjungBox"}]Automaticを使うとLjung–Box検定が適用される:
data = TemporalData[TimeSeries, {{{-1.2593135604759231, -1.2337826909137528, -0.7638166378937818,
-1.4449728297725644, -1.9674559904020306, -2.8822228243276933, -3.3574235160922132,
-0.8140416418708107, 0.6215268695933782, -0.16597774939340448, ... 668776681318445, -15.857838034224033, -15.812986166672088, -16.091212276637293,
-15.747099928115142}}, {{1, 100, 1}}, 1, {"Continuous", 1}, {"Discrete", 1}, 1,
{ResamplingMethod -> {"Interpolation", InterpolationOrder -> 1}}}, False, 10.1];AutocorrelationTest[data, Automatic, Automatic]特性"AutomaticTest"を使ってどちらの検定が使われるかを示すことができる:
AutocorrelationTest[data, Automatic, "AutomaticTest"]data = TemporalData[EventSeries, {{{-0.4816218166541434, -0.16358165397436036, -0.7377817993238698,
-0.42830032446761085, -0.8050227679192111, -1.6764207815550347, -3.168841102281171,
-3.5451201343585863, -4.356842637815697, -4.2959833430028045, ... 12.810533366015934, 11.440254314747376, 13.050176335465256,
12.81022609114599, 11.69008267151061, 11.061560824470149, 12.539224254276276}}, {{1, 100, 1}},
1, {"Continuous", 1}, {"Discrete", 1}, 1, {ResamplingMethod -> None}}, False, 10.1];AutocorrelationTest[data, Automatic, All]特性"AllTests"を使ってどちらの検定が使われたかを明らかにする:
AutocorrelationTest[data, Automatic, "AllTests"]特性を反復的に抽出するためにHypothesisTestDataオブジェクトを作る:
data = TemporalData[EventSeries, {{{-0.7402714131343842, -1.9951233123067933, -1.523976721043832,
-1.2910834619604106, -0.9373249140527381, 0.07332573183193847, 1.671820974185617,
2.395217958334371, 2.6147472293342484, 2.1237526266493236, 1.6700 ... 3224380161044, 14.651432228049682,
14.619485410017823, 15.195180841622236, 14.97128537275672, 15.746556528211672,
15.829432172209756}}, {{1, 100, 1}}, 1, {"Continuous", 1}, {"Discrete", 1}, 1,
{ResamplingMethod -> None}}, False, 10.1];ℋ = AutocorrelationTest[data, Automatic, "HypothesisTestData"];ℋ["Properties"]HypothesisTestDataオブジェクトからいくつかの特性を抽出する:
data = TemporalData[Automatic, {{{1.3393736644750172, 0.21117985738919848, 0.3903496724240176,
1.963771059990626, 3.014004835684255, 4.290457356251644, 4.4653055427847, 4.67004886270268,
5.4883607143737985, 3.5142396668513696, 4.3993670130419344 ... 55187,
12.044839362415239, 10.809871665239243, 8.664439242409841, 9.22431593984081, 7.368217798583508,
6.347313038518147, 6.310434535057582, 6.531051056764879}}, {{1, 100, 1}}, 1, {"Continuous", 1},
{"Discrete", 1}, 1, {}}, False, 9.];ℋ = AutocorrelationTest[data, Automatic, "HypothesisTestData"];ℋ["PValue", "LjungBox"]ℋ["TestStatistic", "LjungBox"]data = TemporalData[Automatic, {{{-0.8237147396568484, -0.6968918994777114, -1.8555451255355737,
0.8696496061008259, -0.4465274055570396, 0.6332299821695397, 0.4484054789748259,
-0.39867658942896933, -0.8215166837808019, -0.6394252941585873, -1. ... , -3.560911692734363, -3.2433567293653445, -3.7249428490104104,
-5.60786219153361, -5.936871579064922, -5.102628105250044, -4.857482036360388,
-4.511335147490319}}, {{1, 100, 1}}, 1, {"Continuous", 1}, {"Discrete", 1}, 1, {}}, False, 9.];ℋ = AutocorrelationTest[data, Automatic, "HypothesisTestData"];ℋ[{"PValue", "BoxPierce"}, {"TestStatistic", "BoxPierce"}]レポート (4)
data = TemporalData[Automatic, {{{-1.0478070046374428, -0.2423815332244802, -2.0504136353778026,
-0.21740382107897993, -0.9208690650265103, -2.026742935027657, -2.7997550914481533,
-3.3436538898130945, -3.8029151219695976, -6.0702838188126, -7.7 ... 497664549511276, -11.000282580085628, -10.520093525498497,
-9.753505073507291, -11.577684742186381, -12.198378006290703, -13.164722402230339,
-12.742400902262268}}, {{1, 100, 1}}, 1, {"Continuous", 1}, {"Discrete", 1}, 1, {}}, False, 9.];ℋ = AutocorrelationTest[data, Automatic, "HypothesisTestData"];ℋ["TestDataTable", All]ℋ["TestDataTable", "LjungBox"]カスタマイズしたレポートのために,検定表から項目を取り出す:
SeedRandom[1];
data = RandomVariate[NormalDistribution[], 1000];ℋ = AutocorrelationTest[data, Automatic, "HypothesisTestData"];res = ℋ["TestData", All];tests = ℋ["AllTests"]
値は0.05より大きいので,このレベルで
を棄却するに十分な証拠はない:
Show[BarChart[res[[All, 2]], ChartLabels -> Placed[tests, Center], BarOrigin -> Left], Graphics[Line[{{.05, 0}, {.05, Length[tests] + 1}}]]]data = TemporalData[TimeSeries, {{{0.8767657841087333, 1.1267187532056928, 2.664943663751166,
2.222370295487063, 3.7389235305679596, 2.389099932467536, 2.2084677834755295,
2.4968034560475574, 1.6404416477913975, 0.6963634685415241, 0.46017629305 ... 309547972566013, -1.4509720853847732, -2.0541691803323197, -1.2302813478710632,
-0.5159914003216842}}, {{1, 100, 1}}, 1, {"Continuous", 1}, {"Discrete", 1}, 1,
{ResamplingMethod -> {"Interpolation", InterpolationOrder -> 1}}}, False, 10.1];ℋ = AutocorrelationTest[data, Automatic, "HypothesisTestData"];ℋ["PValueTable", "LjungBox"]ℋ["PValue", "LjungBox"]ℋ["PValueTable", All]ℋ["PValueTable", {"LjungBox", "BoxPierce"}]data = TemporalData[EventSeries, {{{-1.5936910465744076, -3.357349273906714, -3.965028990320997,
-4.362056613886581, -4.349200453034948, -3.7079978676383623, -4.785830326726696,
-4.690633297205321, -5.820620838560659, -6.2522757649255425, -5.642 ... 93472931, -10.925992907242389,
-10.77026211545831, -10.88669814649508, -11.562651569377277, -11.827959381986176,
-14.565035100006956}}, {{1, 100, 1}}, 1, {"Continuous", 1}, {"Discrete", 1}, 1,
{ResamplingMethod -> None}}, False, 10.1];ℋ = AutocorrelationTest[data, Automatic, "HypothesisTestData"];ℋ["TestStatisticTable"]ℋ["TestStatistic"]ℋ["TestStatisticTable", All]オプション (1)
SignificanceLevel (1)
有意水準は"TestConclusion"および"ShortTestConclusion"に対して用いられる:
SeedRandom[40];
data = RandomVariate[NormalDistribution[], 150];ℋ1 = AutocorrelationTest[data, Automatic, "HypothesisTestData", SignificanceLevel -> .05];ℋ2 = AutocorrelationTest[data, Automatic, "HypothesisTestData", SignificanceLevel -> .005];ℋ1["TestConclusion", "LjungBox"]//TraditionalFormℋ2["TestConclusion", "LjungBox"]//TraditionalFormℋ1["ShortTestConclusion", "LjungBox"]ℋ2["ShortTestConclusion", "LjungBox"]アプリケーション (2)
指導教官が生徒に,各自が選んだソフトウェアを使って100ビットの乱数列を生成するように言った.教官は,適切に生成されなかったビットは見分けられるので注意するようにと加えた.次のデータはそのような2つの例を示している.生徒の一人は言われた通りに乱数生成器を使い,もう一人の生徒は授業の前にビットを走り書きした.どちらの学生がどちらの例を提出したのだろうか:
student1 = {0, 0, 1, 0, 0, 1, 1, 0, 1, 0, 0, 0, 1, 1, 1, 1, 0, 1, 0, 1, 1, 0, 0, 1, 0, 1, 0, 1, 1, 1, 0, 1, 1, 1, 1, 1, 1, 1, 1, 0, 0, 1, 0, 0, 1, 1, 1, 0, 1, 0, 1, 0, 0, 0, 1, 0, 0, 0, 0, 1, 0, 0, 0, 0, 0, 0, 1, 1, 1, 0, 0, 1, 0, 1, 1, 1, 1, 0, 0, 0, 0, 0, 0, 1, 0, 0, 0, 1, 1, 0, 1, 1, 1, 1, 0, 1, 1, 1, 1, 1};student2 = {1, 0, 1, 1, 1, 0, 1, 0, 1, 1, 1, 0, 1, 1, 0, 0, 1, 0, 1, 0, 0, 0, 1, 1, 0, 1, 1, 0, 1, 0, 1, 0, 1, 1, 1, 1, 0, 0, 1, 0, 0, 1, 0, 1, 0, 1, 0, 1, 1, 1, 0, 0, 1, 0, 0, 1, 0, 1, 0, 1, 0, 1, 1, 0, 1, 1, 1, 0, 1, 0, 1, 1, 1, 0, 1, 1, 0, 0, 1, 0, 1, 0, 0, 0, 1, 1, 0, 1, 1, 0, 1, 0, 1, 0, 1, 1, 1, 0, 0, 1, 0, 0, 1, 0, 1, 0, 1, 0, 1};AutocorrelationTest[student1]AutocorrelationTest[student2]時系列モデルを10年分のシカゴの月平均気温データにフィットする.モデルが適切であれば無相関残差が含まれるはずである:
temp = TemporalData[TimeSeries, {{{-1.16, -0.98, 2.7, 12.08, 16.83, 20.78, 24.32, 24.92, 19.28, 13.34,
11.19, 3.3, 1.91, 2.02, 2.36, 10.27, 13.16, 22.26, 26.67, 24.55, 22.07, 11.81, 5.49, 0.88,
-3.71, -2.51, 4.42, 9.55, 13.82, 19.35, 23.29, 24.0 ...
1, {"Discrete", 1}, {"Discrete", 1}, 1,
{ResamplingMethod -> {"Interpolation", InterpolationOrder -> 1},
MetaInformation -> {"Caller" :> TemporalData[WeatherData["Chicago", "Temperature", dates][[All,
2]], dates]}}}, True, 10.1];DateListPlot[temp, Joined -> True]ListPlot[Table[AutocorrelationTest[temp, i], {i, 1, 10}], Filling -> Axis]tsm = TimeSeriesModelFit[temp]モデルの残差は無相関であり,適切なモデルが選ばれたことを示唆している:
ListPlot[Table[AutocorrelationTest[tsm["FitResiduals"], i], {i, 1, 10}], Filling -> Axis, PlotRange -> {0, 1}]考えられる問題 (1)
TemporalDataの最初の経路のみが検定される:
data = TemporalData[Automatic, {{{-0.5736358391118666, -0.11540007328233684, -0.21383441892699334,
0.19292782871188238, -0.6917337157375224, -1.037351661527178, 0.11905916331887398,
-0.5433749375754491, 1.961707920051508, -0.9781052840233547, -0 ... 0.863743719074852, -0.39504908302765473,
-1.1871048600485188, -0.2537143699747824, 0.0771057140597342}}, {{0, 100, 1}, {0, 60, 1}}, 2,
{"Continuous", 2}, {"Discrete", 2}, 1, {ValueDimensions -> 1, ResamplingMethod -> None}}, False,
10.1];data["PathCount"]AutocorrelationTest[data]AutocorrelationTest[data["Path", 1]]テキスト
Wolfram Research (2014), AutocorrelationTest, Wolfram言語関数, https://reference.wolfram.com/language/ref/AutocorrelationTest.html.
CMS
Wolfram Language. 2014. "AutocorrelationTest." Wolfram Language & System Documentation Center. Wolfram Research. https://reference.wolfram.com/language/ref/AutocorrelationTest.html.
APA
Wolfram Language. (2014). AutocorrelationTest. Wolfram Language & System Documentation Center. Retrieved from https://reference.wolfram.com/language/ref/AutocorrelationTest.html
BibTeX
@misc{reference.wolfram_2026_autocorrelationtest, author="Wolfram Research", title="{AutocorrelationTest}", year="2014", howpublished="\url{https://reference.wolfram.com/language/ref/AutocorrelationTest.html}", note=[Accessed: 12-August-2026]}
BibLaTeX
@online{reference.wolfram_2026_autocorrelationtest, organization={Wolfram Research}, title={AutocorrelationTest}, year={2014}, url={https://reference.wolfram.com/language/ref/AutocorrelationTest.html}, note=[Accessed: 12-August-2026]}