AutocorrelationTest[data]
检验 data 是否自相关.
AutocorrelationTest[data,k]
检验 data 是否是最大滞后数为 k 的自相关.
AutocorrelationTest[data,k,"property"]
返回已知模型的 "property" 值.
AutocorrelationTest
AutocorrelationTest[data]
检验 data 是否自相关.
AutocorrelationTest[data,k]
检验 data 是否是最大滞后数为 k 的自相关.
AutocorrelationTest[data,k,"property"]
返回已知模型的 "property" 值.
更多信息和选项
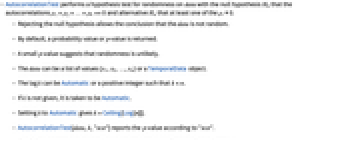
- AutocorrelationTest 对 data 的随机性进行假设检验,其中零假设
是自相关 ρ1=ρ2=…=ρk==0,而备择假设
是至少其中一个 ρi≠0. - 拒绝零假设意味着 data 数据不是随机的结论成立.
- 默认情况下,返回一个概率值或
值. - 小的
-值表示随机的可能性不大. - data 可以是一个值列表 {x1,x2,…,xn} 或 TemporalData 对象.
- 滞后 k 可以是 Automatic,或者满足 k<n 的正整数.
- 如果 k 没有给出,则认为是 Automatic.
- 将 k 设定为 Automatic 给出 k=Ceiling[Log[n]].
- AutocorrelationTest[data,k,"test"] 根据 "test" 报告
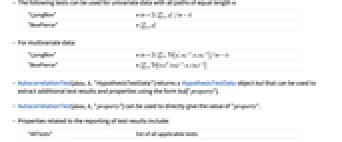
-值. - 下列检验可用于所有路径具有相等长度 n 的单变量数据:
-
"LjungBox" 

"BoxPierce" 
- 对于多变量数据:
-
"LjungBox" 

"BoxPierce" ![n sum_(i=1)^kTr[TemplateBox[{{(, {gamma, _, i}, )}}, Transpose].TemplateBox[{{(, {gamma, _, 0}, )}}, Inverse].gamma_i.TemplateBox[{{(, {gamma, _, 0}, )}}, Inverse]] n sum_(i=1)^kTr[TemplateBox[{{(, {gamma, _, i}, )}}, Transpose].TemplateBox[{{(, {gamma, _, 0}, )}}, Inverse].gamma_i.TemplateBox[{{(, {gamma, _, 0}, )}}, Inverse]]](Files/AutocorrelationTest.zh/1.png)
- AutocorrelationTest[data,k,"HypothesisTestData"] 返回 HypothesisTestData 对象 htd,它可以通过形式 htd["property"] 提取额外的检验结果和属性.
- AutocorrelationTest[data,k,"property"] 可用于直接给出 "property" 的值.
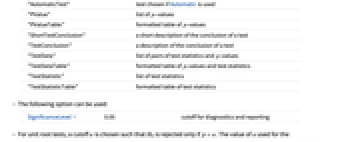
- 有关检测结果的报告内容包括:
-
"AllTests" 所有适用的检验列表 "AutomaticTest" 使用 Automatic 时所选择的检验 "PValue"
-值的列表"PValueTable"
-值的格式化表格"ShortTestConclusion" 检验结论的简短说明 "TestConclusion" 检验结论的说明 "TestData" 检验统计量和
-值对的列表"TestDataTable"
-值和检验统计量的格式化表格"TestStatistic" 检验统计量的列表 "TestStatisticTable" 检验统计量的格式化表格 - 可以使用下列选项:
-
SignificanceLevel 0.05 用于诊断和报告的截止值 - 对于单位根检验,截止值
的选择使得
仅当
时被拒绝. 用于 "TestConclusion" 和 "ShortTestConclusion" 属性的
值由 SignificanceLevel 选项控制. 默认情况下,
设定为 0.05.
范例
打开所有单元 关闭所有单元基本范例 (1)
范围 (14)
检验 (10)
SeedRandom[135];
nac = RandomFunction[ARProcess[{}, 1], {1, 10000}];
ac = RandomFunction[ARProcess[{.1}, 1], {1, 10000}];AutocorrelationTest[nac]AutocorrelationTest[ac]SeedRandom[135];
data = RandomFunction[ARProcess[{}, {{1, 1 / 3}, {1 / 3, 2}}], {1, 10000}]data["ValueDimensions"]AutocorrelationTest[data]SeedRandom[324];
data = RandomFunction[SARIMAProcess[{.3}, 1, {.2}, {12, {.4}, 3, {.2}}, 1], {1, 10 ^ 2}];AutocorrelationTest[data, 5]将滞后设定为 Automatic 等价于使用 Ceiling[Log[n]]:
data = RandomVariate[NormalDistribution[], 100];AutocorrelationTest[data, Automatic]AutocorrelationTest[data, Ceiling[Log[Length[data]]]]data = TemporalData[TimeSeries, {{{-1.2593135604759231, -1.2337826909137528, -0.7638166378937818,
-1.4449728297725644, -1.9674559904020306, -2.8822228243276933, -3.3574235160922132,
-0.8140416418708107, 0.6215268695933782, -0.16597774939340448, ... 668776681318445, -15.857838034224033, -15.812986166672088, -16.091212276637293,
-15.747099928115142}}, {{1, 100, 1}}, 1, {"Continuous", 1}, {"Discrete", 1}, 1,
{ResamplingMethod -> {"Interpolation", InterpolationOrder -> 1}}}, False, 10.1];AutocorrelationTest[data, Automatic, "BoxPierce"]AutocorrelationTest[data, Automatic, {"BoxPierce", "LjungBox"}]使用 Automatic 应用 Ljung–Box 检验:
data = TemporalData[TimeSeries, {{{-1.2593135604759231, -1.2337826909137528, -0.7638166378937818,
-1.4449728297725644, -1.9674559904020306, -2.8822228243276933, -3.3574235160922132,
-0.8140416418708107, 0.6215268695933782, -0.16597774939340448, ... 668776681318445, -15.857838034224033, -15.812986166672088, -16.091212276637293,
-15.747099928115142}}, {{1, 100, 1}}, 1, {"Continuous", 1}, {"Discrete", 1}, 1,
{ResamplingMethod -> {"Interpolation", InterpolationOrder -> 1}}}, False, 10.1];AutocorrelationTest[data, Automatic, Automatic]AutocorrelationTest[data, Automatic, "AutomaticTest"]data = TemporalData[EventSeries, {{{-0.4816218166541434, -0.16358165397436036, -0.7377817993238698,
-0.42830032446761085, -0.8050227679192111, -1.6764207815550347, -3.168841102281171,
-3.5451201343585863, -4.356842637815697, -4.2959833430028045, ... 12.810533366015934, 11.440254314747376, 13.050176335465256,
12.81022609114599, 11.69008267151061, 11.061560824470149, 12.539224254276276}}, {{1, 100, 1}},
1, {"Continuous", 1}, {"Discrete", 1}, 1, {ResamplingMethod -> None}}, False, 10.1];AutocorrelationTest[data, Automatic, All]AutocorrelationTest[data, Automatic, "AllTests"]对于重复的属性提取,创建 HypothesisTestData 对象:
data = TemporalData[EventSeries, {{{-0.7402714131343842, -1.9951233123067933, -1.523976721043832,
-1.2910834619604106, -0.9373249140527381, 0.07332573183193847, 1.671820974185617,
2.395217958334371, 2.6147472293342484, 2.1237526266493236, 1.6700 ... 3224380161044, 14.651432228049682,
14.619485410017823, 15.195180841622236, 14.97128537275672, 15.746556528211672,
15.829432172209756}}, {{1, 100, 1}}, 1, {"Continuous", 1}, {"Discrete", 1}, 1,
{ResamplingMethod -> None}}, False, 10.1];ℋ = AutocorrelationTest[data, Automatic, "HypothesisTestData"];ℋ["Properties"]从 HypothesisTestData 对象提取一些属性:
data = TemporalData[Automatic, {{{1.3393736644750172, 0.21117985738919848, 0.3903496724240176,
1.963771059990626, 3.014004835684255, 4.290457356251644, 4.4653055427847, 4.67004886270268,
5.4883607143737985, 3.5142396668513696, 4.3993670130419344 ... 55187,
12.044839362415239, 10.809871665239243, 8.664439242409841, 9.22431593984081, 7.368217798583508,
6.347313038518147, 6.310434535057582, 6.531051056764879}}, {{1, 100, 1}}, 1, {"Continuous", 1},
{"Discrete", 1}, 1, {}}, False, 9.];ℋ = AutocorrelationTest[data, Automatic, "HypothesisTestData"];ℋ["PValue", "LjungBox"]ℋ["TestStatistic", "LjungBox"]data = TemporalData[Automatic, {{{-0.8237147396568484, -0.6968918994777114, -1.8555451255355737,
0.8696496061008259, -0.4465274055570396, 0.6332299821695397, 0.4484054789748259,
-0.39867658942896933, -0.8215166837808019, -0.6394252941585873, -1. ... , -3.560911692734363, -3.2433567293653445, -3.7249428490104104,
-5.60786219153361, -5.936871579064922, -5.102628105250044, -4.857482036360388,
-4.511335147490319}}, {{1, 100, 1}}, 1, {"Continuous", 1}, {"Discrete", 1}, 1, {}}, False, 9.];ℋ = AutocorrelationTest[data, Automatic, "HypothesisTestData"];ℋ[{"PValue", "BoxPierce"}, {"TestStatistic", "BoxPierce"}]报告 (4)
data = TemporalData[Automatic, {{{-1.0478070046374428, -0.2423815332244802, -2.0504136353778026,
-0.21740382107897993, -0.9208690650265103, -2.026742935027657, -2.7997550914481533,
-3.3436538898130945, -3.8029151219695976, -6.0702838188126, -7.7 ... 497664549511276, -11.000282580085628, -10.520093525498497,
-9.753505073507291, -11.577684742186381, -12.198378006290703, -13.164722402230339,
-12.742400902262268}}, {{1, 100, 1}}, 1, {"Continuous", 1}, {"Discrete", 1}, 1, {}}, False, 9.];ℋ = AutocorrelationTest[data, Automatic, "HypothesisTestData"];ℋ["TestDataTable", All]ℋ["TestDataTable", "LjungBox"]SeedRandom[1];
data = RandomVariate[NormalDistribution[], 1000];ℋ = AutocorrelationTest[data, Automatic, "HypothesisTestData"];res = ℋ["TestData", All];tests = ℋ["AllTests"]Show[BarChart[res[[All, 2]], ChartLabels -> Placed[tests, Center], BarOrigin -> Left], Graphics[Line[{{.05, 0}, {.05, Length[tests] + 1}}]]]data = TemporalData[TimeSeries, {{{0.8767657841087333, 1.1267187532056928, 2.664943663751166,
2.222370295487063, 3.7389235305679596, 2.389099932467536, 2.2084677834755295,
2.4968034560475574, 1.6404416477913975, 0.6963634685415241, 0.46017629305 ... 309547972566013, -1.4509720853847732, -2.0541691803323197, -1.2302813478710632,
-0.5159914003216842}}, {{1, 100, 1}}, 1, {"Continuous", 1}, {"Discrete", 1}, 1,
{ResamplingMethod -> {"Interpolation", InterpolationOrder -> 1}}}, False, 10.1];ℋ = AutocorrelationTest[data, Automatic, "HypothesisTestData"];ℋ["PValueTable", "LjungBox"]ℋ["PValue", "LjungBox"]ℋ["PValueTable", All]ℋ["PValueTable", {"LjungBox", "BoxPierce"}]data = TemporalData[EventSeries, {{{-1.5936910465744076, -3.357349273906714, -3.965028990320997,
-4.362056613886581, -4.349200453034948, -3.7079978676383623, -4.785830326726696,
-4.690633297205321, -5.820620838560659, -6.2522757649255425, -5.642 ... 93472931, -10.925992907242389,
-10.77026211545831, -10.88669814649508, -11.562651569377277, -11.827959381986176,
-14.565035100006956}}, {{1, 100, 1}}, 1, {"Continuous", 1}, {"Discrete", 1}, 1,
{ResamplingMethod -> None}}, False, 10.1];ℋ = AutocorrelationTest[data, Automatic, "HypothesisTestData"];ℋ["TestStatisticTable"]ℋ["TestStatistic"]ℋ["TestStatisticTable", All]选项 (1)
SignificanceLevel (1)
显著性水平用于 "TestConclusion" 和 "ShortTestConclusion":
SeedRandom[40];
data = RandomVariate[NormalDistribution[], 150];ℋ1 = AutocorrelationTest[data, Automatic, "HypothesisTestData", SignificanceLevel -> .05];ℋ2 = AutocorrelationTest[data, Automatic, "HypothesisTestData", SignificanceLevel -> .005];ℋ1["TestConclusion", "LjungBox"]//TraditionalFormℋ2["TestConclusion", "LjungBox"]//TraditionalFormℋ1["ShortTestConclusion", "LjungBox"]ℋ2["ShortTestConclusion", "LjungBox"]应用 (2)
一位老师要求她的学生用他们所选择的软件来生成100随机位的序列. 她警告说,她会识别没有适当生成的位数. 下面的数据显示了两个这样的例子. 一名学生按要求使用随机数生成器,而另一名学生则是在上课前草草地写下了一些数. 请辨认这两个例子分别是哪名学生的作品:
student1 = {0, 0, 1, 0, 0, 1, 1, 0, 1, 0, 0, 0, 1, 1, 1, 1, 0, 1, 0, 1, 1, 0, 0, 1, 0, 1, 0, 1, 1, 1, 0, 1, 1, 1, 1, 1, 1, 1, 1, 0, 0, 1, 0, 0, 1, 1, 1, 0, 1, 0, 1, 0, 0, 0, 1, 0, 0, 0, 0, 1, 0, 0, 0, 0, 0, 0, 1, 1, 1, 0, 0, 1, 0, 1, 1, 1, 1, 0, 0, 0, 0, 0, 0, 1, 0, 0, 0, 1, 1, 0, 1, 1, 1, 1, 0, 1, 1, 1, 1, 1};student2 = {1, 0, 1, 1, 1, 0, 1, 0, 1, 1, 1, 0, 1, 1, 0, 0, 1, 0, 1, 0, 0, 0, 1, 1, 0, 1, 1, 0, 1, 0, 1, 0, 1, 1, 1, 1, 0, 0, 1, 0, 0, 1, 0, 1, 0, 1, 0, 1, 1, 1, 0, 0, 1, 0, 0, 1, 0, 1, 0, 1, 0, 1, 1, 0, 1, 1, 1, 0, 1, 0, 1, 1, 1, 0, 1, 1, 0, 0, 1, 0, 1, 0, 0, 0, 1, 1, 0, 1, 1, 0, 1, 0, 1, 0, 1, 1, 1, 0, 0, 1, 0, 0, 1, 0, 1, 0, 1, 0, 1};AutocorrelationTest[student1]AutocorrelationTest[student2]用芝加哥在10年期间的一些月平均气温数据,拟合时间序列模型. 适当的模型应该有不相关的残差:
temp = TemporalData[TimeSeries, {{{-1.16, -0.98, 2.7, 12.08, 16.83, 20.78, 24.32, 24.92, 19.28, 13.34,
11.19, 3.3, 1.91, 2.02, 2.36, 10.27, 13.16, 22.26, 26.67, 24.55, 22.07, 11.81, 5.49, 0.88,
-3.71, -2.51, 4.42, 9.55, 13.82, 19.35, 23.29, 24.0 ...
1, {"Discrete", 1}, {"Discrete", 1}, 1,
{ResamplingMethod -> {"Interpolation", InterpolationOrder -> 1},
MetaInformation -> {"Caller" :> TemporalData[WeatherData["Chicago", "Temperature", dates][[All,
2]], dates]}}}, True, 10.1];DateListPlot[temp, Joined -> True]ListPlot[Table[AutocorrelationTest[temp, i], {i, 1, 10}], Filling -> Axis]tsm = TimeSeriesModelFit[temp]ListPlot[Table[AutocorrelationTest[tsm["FitResiduals"], i], {i, 1, 10}], Filling -> Axis, PlotRange -> {0, 1}]可能存在的问题 (1)
仅检验 TemporalData 的第一个路径:
data = TemporalData[Automatic, {{{-0.5736358391118666, -0.11540007328233684, -0.21383441892699334,
0.19292782871188238, -0.6917337157375224, -1.037351661527178, 0.11905916331887398,
-0.5433749375754491, 1.961707920051508, -0.9781052840233547, -0 ... 0.863743719074852, -0.39504908302765473,
-1.1871048600485188, -0.2537143699747824, 0.0771057140597342}}, {{0, 100, 1}, {0, 60, 1}}, 2,
{"Continuous", 2}, {"Discrete", 2}, 1, {ValueDimensions -> 1, ResamplingMethod -> None}}, False,
10.1];data["PathCount"]AutocorrelationTest[data]AutocorrelationTest[data["Path", 1]]文本
Wolfram Research (2014),AutocorrelationTest,Wolfram 语言函数,https://reference.wolfram.com/language/ref/AutocorrelationTest.html.
CMS
Wolfram 语言. 2014. "AutocorrelationTest." Wolfram 语言与系统参考资料中心. Wolfram Research. https://reference.wolfram.com/language/ref/AutocorrelationTest.html.
APA
Wolfram 语言. (2014). AutocorrelationTest. Wolfram 语言与系统参考资料中心. 追溯自 https://reference.wolfram.com/language/ref/AutocorrelationTest.html 年
BibTeX
@misc{reference.wolfram_2026_autocorrelationtest, author="Wolfram Research", title="{AutocorrelationTest}", year="2014", howpublished="\url{https://reference.wolfram.com/language/ref/AutocorrelationTest.html}", note=[Accessed: 10-August-2026]}
BibLaTeX
@online{reference.wolfram_2026_autocorrelationtest, organization={Wolfram Research}, title={AutocorrelationTest}, year={2014}, url={https://reference.wolfram.com/language/ref/AutocorrelationTest.html}, note=[Accessed: 10-August-2026]}