

Fit
Details and Options
- Fit is also known as linear regression or least squares fit. With regularization, it is also known as LASSO and ridge regression.
- Fit is typically used for fitting combinations of functions to data, including polynomials and exponentials. It provides one of the simplest ways to get a model from data.
- The best fit minimizes the sum of squares
 .
. - The data can have the following forms:
-
{v1,…,vn} equivalent to {{1,v1},…,{n,vn}} {{x1,v1},…,{xn,vn}} univariate data with values vi at coordinates xi {{x1,y1,v1},…} bivariate data with values vi and coordinates {xi,yi} {{x1,y1,…,v1},…} multivariate data with values vi at coordinates {xi,yi,…} - The design matrix m has elements that come from evaluating the functions at the coordinates,
 . In matrix notation, the best fit minimizes the norm
  where
where  and
and  .
. - The functions fi should depend only on the variables {x,y,…}.
- The possible fit properties "prop" include:
-
"BasisFunctions" funs the basis functions "BestFit" 
the best fit linear combination of basis functions "BestFitParameters" 
the vector  that gives the best fit
"Coordinates" {{x1,y1,…},…} the coordinates of vars in data "Data" data the data "DesignMatrix" m 
"FitResiduals" 
the differences between the model and the fit at the coordinates "Function" Function[{x,y,…},a1 f1+…+an fn] best fit pure function "PredictedResponse" 
fitted values for the data coordinates "Response" 
the response vector  from the input data
{"prop1","prop2",…} several fit properties - Fit takes the following options:
-
NormFunction Norm measure of the deviations to minimize FitRegularization None regularization for the fit parameters 
WorkingPrecision Automatic the precision to use - With NormFunction->normf and FitRegularization->rfun, Fit finds the coefficient vector a that minimizes normf[{a.f(x1,y1,…)-v1,…,a.f(xk,yk,…)-vk}] + rfun[a].
- The setting for NormFunction can be given in the following forms:
-
normf a function normf that is applied to the deviations {"Penalty", pf} sum of the penalty function pf applied to each component of the deviations {"HuberPenalty",α} sum of Huber penalty function for each component {"DeadzoneLinearPenalty",α} sum of deadzone linear penalty function for each component - The setting for FitRegularization may be given in the following forms:
-
None no regularization rfun regularize with rfun[a] {"Tikhonov",λ} regularize with 
{"LASSO",λ} regularize with 
{"Variation",λ} regularize with ![lambda||TemplateBox[{Differences, paclet:ref/Differences}, RefLink, BaseStyle -> {2ColumnTableMod}][a]||^2](Files/Fit.en/19.png "lambda||TemplateBox[{Differences, paclet:ref/Differences}, RefLink, BaseStyle -> {2ColumnTableMod}][a]||^2")
{"TotalVariation",λ} regularize with ![lambda||TemplateBox[{Differences, paclet:ref/Differences}, RefLink, BaseStyle -> {2ColumnTableMod}][a]||_1](Files/Fit.en/20.png "lambda||TemplateBox[{Differences, paclet:ref/Differences}, RefLink, BaseStyle -> {2ColumnTableMod}][a]||_1")
{"Curvature",λ} regularize with ![lambda||TemplateBox[{Differences, paclet:ref/Differences}, RefLink, BaseStyle -> {2ColumnTableMod}][a,2]||^2](Files/Fit.en/21.png "lambda||TemplateBox[{Differences, paclet:ref/Differences}, RefLink, BaseStyle -> {2ColumnTableMod}][a,2]||^2")
{r1,r2,…} regularize with the sum of terms from r1,… - With WorkingPrecision->Automatic, exact numbers given as input to Fit are converted to approximate numbers with machine precision.

Examples
open all close allBasic Examples (2)
data = {{0, 1}, {1, 0}, {3, 2}, {5, 4}};Find the line that best fits the data:
line = Fit[data, {1, x}, x]DesignMatrix[data, {1, x}, x]Find the quadratic that best fits the data:
parabola = Fit[data, {1, x, x ^ 2}, x]Show the data with the two curves:
Show[ListPlot[data, PlotStyle -> Red], Plot[{line, parabola}, {x, 0, 5}]]Find the best fit parameters given a design matrix and response vector:
m = N[HilbertMatrix[4]];
v = Range[4];
a = Fit[{m, v}]
Scope (2)
Here is some data defined with exact values:
data = {{-Pi, 4}, {-Pi / 2, 0}, {0, 1}, {Pi / 2, -1}, {Pi, -4}};Fit the data to a linear combination of sine functions using machine arithmetic:
Fit[data, {Sin[x / 2], Sin[x], Sin[2 x]}, x]Fit the data using 24-digit precision arithmetic:
Fit[N[data, 24], {Sin[x / 2], Sin[x], Sin[2 x]}, x]Show[ListPlot[data], Plot[%, {x, -Pi, Pi}], PlotRange -> All]Here is some data in three dimensions:
data = {{0, 0, 0}, {1, 0, 1}, {0, 1, 2}, {1, 1, 0}, {1 / 2, 1 / 2, 1}};Find the plane that best fits the data:
plane = Fit[data, {1, x, y}, {x, y}]Show the plane with the data points:
Show[Plot3D[plane, {x, 0, 1}, {y, 0, 1}, PlotStyle -> Opacity[.5], PlotRange -> {0, 2}], Graphics3D[{Red, PointSize[0.05], Map[Point, data]}]]Find the quadratic that best fits the data:
quad = Fit[data, {1, x, y, x ^ 2, x y, y ^ 2}, {x, y}]The quadratic actually interpolates the data:
Show[Plot3D[quad, {x, 0, 1}, {y, 0, 1}, PlotStyle -> Opacity[.5], PlotRange -> {0, 2}], Graphics3D[{Red, PointSize[0.05], Map[Point, data]}]]Generalizations & Extensions (1)
v = {5, 4, 3, 2, 1, 0, 1, 2, 3, 4, 5};Fit to a quadratic. When coordinates are not given, the values are assumed to be paired up with 1, 2, …:
quad = Fit[v, {1, x, x ^ 2}, x]quart = Fit[v, {1, x, x ^ 2, x ^ 3, x ^ 4}, x]Show[ListPlot[v, PlotStyle -> Red], Plot[{quad, quart}, {x, 1, Length[v]}]]Options (6)
FitRegularization (2)
Tikhonov regularization controls the size of the best fit parameters:
data = {{0., 0.}, {0.001, 1}, {0.01, 1}};Fit[data, {1, x, x ^ 2}, x, FitRegularization -> {"Tikhonov", 1}]Without the regularization, the coefficients are quite large:
Fit[data, {1, x, x ^ 2}, x]This can also be referred to by "L2" or "RidgeRegression":
Fit[data, {1, x, x ^ 2}, x, FitRegularization -> {"L2", 1}]Fit[data, {1, x, x ^ 2}, x, FitRegularization -> {"RidgeRegression", 1}]LASSO (least absolute shrinkage and selection operator) regularization selects the most significant basis functions and gives some control of the size of the best fit parameters:
data = {{0., 0.}, {0.001, 1}, {0.01, 1}, {.1, 0}, {1, 1}};Fit[data, {1, x, x ^ 2, x ^ 3, x ^ 4}, x, FitRegularization -> {"LASSO", 1}]Without the regularization, the coefficients are quite large:
Fit[data, {1, x, x ^ 2, x ^ 3, x ^ 4}, x]This can also be referred to by "L1":
Fit[data, {1, x, x ^ 2, x ^ 3, x ^ 4}, x, FitRegularization -> {"L1", 1}]NormFunction (3)
Measure the "best" fit using the 1-norm:
data = {{0, 1}, {1, 0}, {3, 2}, {5, 4}};l1 = Fit[data, {1, x}, x, NormFunction -> Function[Norm[#, 1]]]Show[ListPlot[data, PlotStyle -> PointSize[0.025]], Plot[l1, {x, 0, 5}], PlotRange -> All]Compare with the least squares (gold) and max norm (green) fits:
l2 = Fit[data, {1, x}, x];
l∞ = Fit[data, {1, x}, x, NormFunction -> Function[Norm[#, ∞]]];
Show[ListPlot[data, PlotStyle -> PointSize[0.025]], Plot[{l1, l2, l∞}, {x, 0, 5}], PlotRange -> All]
Manipulate the norm p interactively:
Manipulate[Plot[Evaluate[With[{q = 1 / pr}, Fit[data, {1, x}, x, NormFunction -> Function[Norm[#, q]]]]], {x, 0, 5}, PlotRange -> {-1, 4}, Epilog -> {PointSize[.025], Point[data], Text["p = " <> ToString[1 / pr], {1, 3}]}], {{pr, 1 / 2, "1/p"}, 0.0001, .9999}, SaveDefinitions -> True]Use the Huber penalty function to balance the influence of outliers with least squares:
data = {{0, 1}, {1, 0}, {3, 2}, {5, 4}};hfit = Fit[data, {1, x}, x, NormFunction -> {"HuberPenalty", .1}]Show[ListPlot[data, PlotStyle -> PointSize[0.025]], Plot[hfit, {x, 0, 5}], PlotRange -> All]Manipulate the parameter ![]() interactively:
interactively:
Manipulate[Plot[Evaluate[Fit[data, {1, x}, x, NormFunction -> {"HuberPenalty", α}]], {x, 0, 5}, PlotRange -> {-1, 4}, Epilog -> {PointSize[.025], Point[data], Text["α = " <> ToString[α], {1, 3}]}], {{α, .1}, 0.0001, 2}, SaveDefinitions -> True]Compute a weighted least squares fit:
data = {{0, 1}, {1, 0}, {3, 2}, {5, 4}};
fit = Fit[data, {1, x}, x, NormFunction -> Function[Norm[#  Range[4]]]];
Show[ListPlot[data, PlotStyle -> PointSize[0.025]], Plot[fit, {x, 0, 5}], PlotRange -> All]Applications (6)
Compute a high-degree polynomial fit to data using a Chebyshev basis:
coord = RandomReal[{-1, 1}, 100];
data = Transpose[{coord, Sinc[10 coord]}];degree = 47;
basis = Table[ChebyshevT[k, x], {k, 0, degree}];
fit = Fit[data, basis, x];Plot[fit, {x, -1, 1}, Epilog -> Point[data]]Use regularization to stabilize the numerical solution ![]() to
to ![]() where
where ![]() is perturbed:
is perturbed:
a = N[HilbertMatrix[47]];
xexact = Table[t * (1 - t), {t, 0., 1., 1 / 46}];
b = a.xexact + 10^ - 8 RandomReal[{-1, 1}, 47];
The solution found by LinearSolve has very large entries:
ListPlot[LinearSolve[a, b]]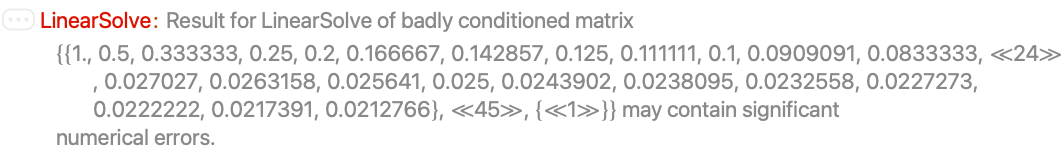
Regularized solutions stay much closer to the solution of the unperturbed problem:
xreg = Table[Fit[{a, b}, FitRegularization -> {"Tikhonov", 10 ^ -ll}], {ll, 0, 3, 2}];ListPlot[Prepend[xreg, xexact], PlotStyle -> PointSize[0.025]]Use variation regularization to find a smooth approximation for an input signal:
n = 201;
m = 201;
times = Range[m];
The output target is a step function:
m1 = Round[m / 5]; m2 = Round[m / 4]; m3 = Round[m / 4];output = ConstantArray[0, m];
output[[m1 + Range[m2]]] = 1;
output[[m1 + m2 + Range[m3]]] = -1;
op = ListLinePlot[output]
The input is determined from the output via convolution with ![]() :
:
h = (1/9)(1 - .4Cos[2 times]) * .9 ^ times;hmat = ToeplitzMatrix[h, Prepend[ConstantArray[0, n - 1], h[[1]]]];Without regularization, the predicated response matches the signal very closely, but the computed input has a lot of oscillation:
{input, predicted} = Fit[{hmat, output}, {"BestFitParameters", "PredictedResponse"}];
Row[{ListLinePlot[input], ListLinePlot[{predicted, output}]}]
With regularization of the variation, a much smoother approximation can be found:
{input, predicted} = Fit[{hmat, output}, {"BestFitParameters", "PredictedResponse"}, FitRegularization -> {"Variation", .3}];
Row[{ListLinePlot[input], ListLinePlot[{predicted, output}]}]
Regularization of the input size may also be included:
{input, predicted} = Fit[{hmat, output}, {"BestFitParameters", "PredictedResponse"}, FitRegularization -> {{"Variation", .3}, {"Tikhonov", .01}}];
Row[{ListLinePlot[input], ListLinePlot[{predicted, output}]}]
Smooth a corrupted signal using variation regularization:
n = 4000;
times = N[Range[0, n - 1]];
original = .5 Sin[2 Pi times / n] * Sin[.01 times];
corrupted = original + RandomReal[{-.05, .05}, n];
ListLinePlot[corrupted]
Plot the tradeoff between the norm of the residuals and the norm of the variation:
id = IdentityMatrix[n, SparseArray];tradeoff = Table[{smoothed, residual} = Fit[{id, corrupted}, {"BestFitParameters", "FitResiduals"}, FitRegularization -> {"Variation", 2 ^ logλ}];Tooltip[{Norm[Differences[smoothed]], Norm[residual]}, 2. ^ logλ], {logλ, -10, 20}];ListPlot[tradeoff, Joined -> True, Mesh -> All]Choose a value of ![]() near where the curve bends sharply:
near where the curve bends sharply:
smoothed = Fit[{id, corrupted}, "BestFitParameters", FitRegularization -> {"Variation", 100}];ListLinePlot[{corrupted, smoothed}]Use total variation regularization to smooth a corrupted signal with jumps:
n = 2000;
id = IdentityMatrix[n, SparseArray];
times = Range[0, n - 1];
temp = ConstantArray[1, n / 4];
original = Join[temp, -temp, temp, -temp] + .5 Sin[2 Pi times / n];
corrupted = original + RandomReal[{-.1, .1}, n];
ListLinePlot[{corrupted, original}]
Regularize with the parameter ![]() :
:
smoothed = Fit[{id, corrupted}, "BestFitParameters", FitRegularization -> {"TotalVariation", 2.}];ListLinePlot[{smoothed, original}]A smaller value of ![]() gives less smoothing but the residual norm is smaller:
gives less smoothing but the residual norm is smaller:
lesssmoothed = Fit[{id, corrupted}, "BestFitParameters", FitRegularization -> {"TotalVariation", .1}];ListLinePlot[{lesssmoothed, original}]{Norm[original - smoothed], Norm[original - lesssmoothed]}Use LASSO (L1) regularization to find a sparse fit (basis pursuit):
σ = 0.05;
nτ = 500;
times = Subdivide[0., 1., nτ];
nω = 30;signal = (1 + .5 Sin[11 times])Sin[30 Sin[5 times]];
sdata = Transpose[{times, signal}];
ListLinePlot[sdata]The goal is to approximate the signal with just of few of the thousands of Gabor basis functions:
Length[basis = Flatten[
	Table[Exp[-(((t - τ)/σ))^2]
	{1, Table[{Cos[ω t], Sin[ω t]}, {ω, Drop[Subdivide[0., 150., nω], 1]}]},
	{τ, Subdivide[0., 1., nτ]}]]]
With ![]() , a fit is found using only 41 of the basis elements:
, a fit is found using only 41 of the basis elements:
AbsoluteTiming[sparseFit = Fit[sdata, basis, t, "BestFitParameters", FitRegularization -> {"LASSO", 1.}]]fitt = basis.sparseFit /. t -> times;
ListLinePlot[Transpose[{times, signal - fitt}]]Once the important elements of the basis have been found, error can be reduced by finding the least squares fit to these elements:
bpos = Flatten[sparseFit["NonzeroPositions"]];
sbasis = basis[[bpos]];
sbfit = Fit[sdata, sbasis, t];
ListLinePlot[Transpose[{times, signal - (sbfit /. t -> times)}], PlotRange -> All]
With a smaller value ![]() , a fit is found using more of the basis elements:
, a fit is found using more of the basis elements:
AbsoluteTiming[sparseFit = Fit[sdata, basis, t, "BestFitParameters", FitRegularization -> {"LASSO", 0.1}]]fitt = basis.sparseFit /. t -> times;
ListLinePlot[Transpose[{times, signal - fitt}]]Properties & Relations (5)
Fit gives the best fit function:
Fit[Range[10], {1, x ^ 2}, x]LinearModelFit allows for extraction of additional information about the fitting:
lm = LinearModelFit[Range[10], x ^ 2, x]lm["BestFit"]Extract additional results and diagnostics:
lm[{"RSquared", "FitResiduals", "ANOVATable"}]data = {{0, 1}, {1, 0}, {3, 2}, {5, 4}};This is the sum of squares error for a line a+b x:
ss[a_, b_] = Block[{x = data[[All, 1]], y = data[[All, 2]], res}, res = y - (a + b x);res.res]Find the minimum symbolically:
Minimize[ss[a, b], {a, b}]N[a + b x /. %[[2]]]These are the coefficients given by Fit:
Fit[data, {1, x}, x]The exact coefficients may be found by using WorkingPrecision->Infinity:
Fit[data, {1, x}, x, "BestFitParameters", WorkingPrecision -> Infinity]This is the sum of squares error for a quadratic a+b x+c x^2:
ss[a_, b_, c_] = Block[{x = data[[All, 1]], y = data[[All, 2]], res}, res = y - (a + b x + c x ^ 2);res.res]Find the minimum symbolically:
Minimize[ss[a, b, c], {a, b, c}]N[a + b x + c x ^ 2 /. %[[2]]]These are the coefficients given by Fit:
Fit[data, {1, x, x ^ 2}, x, "BestFitParameters", WorkingPrecision -> Infinity]When a polynomial fit is done to a high enough degree, Fit returns the interpolating polynomial:
data = {{0, 1}, {1, 0}, {3, 2}, {5, 4}};
Fit[data, {1, x, x ^ 2, x ^ 3}, x]
The result is consistent with that given by InterpolatingPolynomial:
InterpolatingPolynomial[data, x]N[Expand[%]]Fit will use the time stamps of a TimeSeries as variables:
ts1 = TemporalData[TimeSeries, {{{1.102448341846048, 6.331833897009389, 7.5843632999043455,
    44.59969789743589, 98.76273258351092, 150.00729051003992, 644.7367359379259,
    1724.3968817536402, 5903.697723461762, 19468.09340765025}}, {{0, 9, 1}}, 1, {"Continuous", 1},
  {"Discrete", 1}, 1, {ResamplingMethod -> {"Interpolation", InterpolationOrder -> 1}}}, False,
10.1];ts1["Times"]base = {1, Exp[x], Exp[2 x], Exp[x ^ 2]};Fit[ts1, base, x]Rescale the time stamps and fit again:
ts2 = TimeSeriesRescale[ts1, {.1, 2}]ts2["Times"]Fit[ts2, base, x]Fit[ts1["Values"], base, x]Fit acts pathwise on a multipath TemporalData:
Fit[TemporalData[Automatic, {{{1.102448341846048, 6.331833897009389, 7.5843632999043455,
    44.59969789743589, 98.76273258351092, 150.00729051003992, 644.7367359379259,
    1724.3968817536402, 5903.697723461762, 19468.09340765025},
   {1.1024483418 ... 7359379259, 1724.3968817536402, 5903.697723461762,
    19468.09340765025}}, {{0, 9, 1}, {0.1, 2., 0.2111111111111111}}, 2, {"Continuous", 2},
  {"Discrete", 2}, 1, {ResamplingMethod -> {"Interpolation", InterpolationOrder -> 1}}}, False,
 10.1], {1, Exp[x], Exp[2 x]}, x]
Possible Issues (2)
Here is some data from a random perturbation of a Gaussian:
data = Block[{r = RandomReal[100, 100]}, Transpose[{r, Exp[-(r - 50) ^ 2 / 10] + RandomReal[.1, 100]}]];
lp = ListPlot[data, PlotRange -> All]
This is a function that gives the standard basis for polynomials:
nbasis[n_Integer][x_] := Table[x ^ k, {k, 0, n}]nbasis[10][x]Show the fits computed for successively higher-degree polynomials:
Table[
	fit = Fit[data, nbasis[n][x], x];
	Show[Plot[fit, {x, 0, 100}, PlotRange -> All], lp, PlotRange -> {-.25, 1}, PlotLabel -> "n = " <> ToString[n]],
	{n, 10, 40, 10}]
The problem is that the coefficients get very small for higher powers:
Fit[data, nbasis[10][x], x]Giving the basis in terms of scaled and shifted values helps with this problem:
Table[
	fit = Fit[data, nbasis[n][(x - 50) / 50], x];
	Show[Plot[fit, {x, 0, 100}, PlotRange -> All], lp, PlotRange -> {-.25, 1}, PlotLabel -> "n = " <> ToString[n]],
	{n, 10, 40, 10}]
Reconstruct a sparse signal from compressed sensing data:
k = 7;
n = 1000;
signal = Normal[SparseArray[RandomInteger[{1, n}, k] -> RandomReal[{-1, 1}, k], {n}]];
ListPlot[signal, Filling -> Axis]
Compressed sensing consists of multiplying the signal with an ![]() matrix with
matrix with ![]() so only data of length
so only data of length ![]() has to be transmitted. If
has to be transmitted. If ![]() is large enough, a random matrix with independently identically distributed normal entries will satisfy the restricted isometry property, and the original signal can be recovered with very high probability:
is large enough, a random matrix with independently identically distributed normal entries will satisfy the restricted isometry property, and the original signal can be recovered with very high probability:
m = Ceiling[6 k Log[n / k]]a = RandomVariate[NormalDistribution[0, 1 / m], {m, n}];The samples to send are constructed by multiplication of the signal with the matrix ![]() :
:
samples = a.signal;Reconstruction can be done by minimizing ![]() for all possible solutions of
for all possible solutions of ![]() :
:
AbsoluteTiming[reconstructed = NArgMin[{Norm[x, 1], a.x == samples}, x];]Max[Abs[reconstructed - signal]]Even though the minimization is solved by linear optimization, it is relatively slow because all the constraints are equality constraints. The solution can be found much faster using basis pursuit (L1 regularization):
AbsoluteTiming[bpsol = Fit[{a, samples}, FitRegularization -> {"L1", 0.0001}]]This gives the basis elements. To find the best solution, solve the linear equations corresponding to those components:
basisPositions = bpsol["NonzeroPositions"];
values = LinearSolve[a[[All, Flatten[basisPositions]]], samples];
bpReconstructed = SparseArray[basisPositions -> values, {n}]Max[Abs[bpReconstructed - signal]]Related Links
Text
Wolfram Research (1988), Fit, Wolfram Language function, https://reference.wolfram.com/language/ref/Fit.html (updated 2019).
CMS
Wolfram Language. 1988. "Fit." Wolfram Language & System Documentation Center. Wolfram Research. Last Modified 2019. https://reference.wolfram.com/language/ref/Fit.html.
APA
Wolfram Language. (1988). Fit. Wolfram Language & System Documentation Center. Retrieved from https://reference.wolfram.com/language/ref/Fit.html