Function Visualization
 Topic Overview
 Long the standard for high-quality function and surface visualization, the Wolfram Language incorporates a host of original numeric, symbolic, and geometric algorithms that automate the immediate creation of highly aesthetic and technically correct 2D and 3D visualizations.
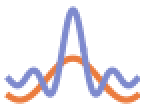 Plot — curves of one or more functions
 ![]()
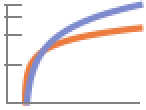 LogPlot ▪ LogLinearPlot ▪ LogLogPlot
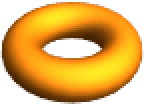
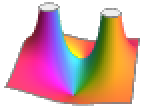
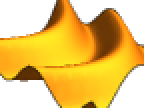 Plot3D — 3D surfaces of one or more functions
 ![]()
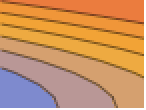 ContourPlot — contour plot for a function
 ![]() or curve
or curve ![]()
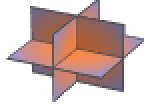
 ContourPlot3D — 3D contour plot for a function
 ![]() or surface
or surface ![]()
 SliceContourPlot3D — 2D contours over slice surfaces for a function
 ![]()
 DensityPlot — density plot for a function
 ![]()
 DensityPlot3D — density plot for a function
 ![]()
 SliceDensityPlot3D — density plots over slice surfaces for a function
 ![]()
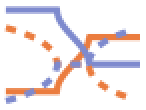
 ParametricPlot — 2D parametric curves or regions
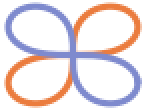
 ParametricPlot3D — 3D parametric curves or surfaces
 PolarPlot ▪
 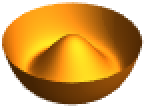 RevolutionPlot3D ▪
 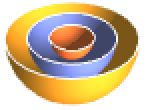 SphericalPlot3D
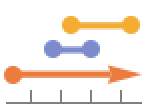 NumberLinePlot — 1D regions defined by equations, inequalities, and intervals
 RegionPlot — 2D regions defined by inequalities
 RegionPlot3D — 3D regions defined by inequalities
Complex Function Visualization »
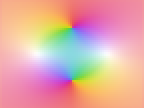 ComplexPlot — use color to plot the phase and magnitude of a function
 ComplexPlot3D — use color and height to plot the phase and magnitude of a function
 ReImPlot ▪
 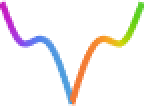 AbsArgPlot ▪ ...
Discrete Function Visualization »
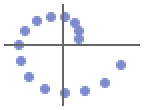
 DiscretePlot — plot functions
 ![]() of a discrete variable
of a discrete variable
 DiscretePlot3D — plot functions
 ![]() of discrete variables
of discrete variables
 ListPlot ▪
 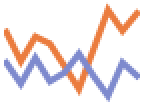 ListLinePlot ▪
 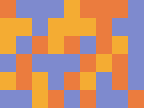 ArrayPlot ▪ ...
Vector Function Visualization »
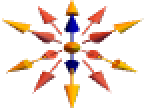
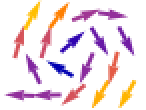 VectorPlot — plot vectors from a vector field function
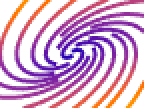 StreamPlot — plot streamlines from a vector field function
 VectorPlot3D ▪
 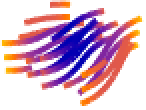 StreamPlot3D ▪
 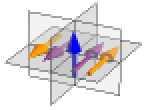 SliceVectorPlot3D ▪ ...
Styling Options »
Frame ▪ PlotStyle ▪ Filling ▪ Mesh ▪ ImageSize ▪ ...
Labels »
PlotLabels ▪ Labeled ▪ Callout ▪ ...
Legends »
PlotLegends ▪  LineLegend ▪
  BarLegend ▪ ...
Annotation & Combination »
Tooltip ▪ StatusArea ▪ GraphicsGrid ▪ ...