BarLegend
詳細とオプション
- BarLegendは色関数 cf 関連付けられた色のリストを使って,可視化あるいはその他の凡例項目の min から max までの contours を識別する.
- BarLegendはContourPlotやListContourPlot等の関数で自動的に使用される.
- 可視化関数内では,BarLegend[Automatic,…]のAutomaticは,自動的に,等高線の値と等高線間の色の指定に必要な,実際の色関数,データ範囲,等高線の指定に置き換えられる.
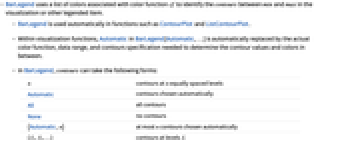
- BarLegendでは,contours は次の形を取ることができる.
-
n n 個の等間隔のレベルの等高線 Automatic 自動的に選ばれた等高線 All すべての等高線 None 等高線は使わない {Automatic,n} 自動的に選ばれた最高で n 本の等高線 {f1,f2,…} レベル fiの等高線 {{f1,gr1},…} グラフィックス指示子 griを使って描かれた等高線 func zmin, zmax に適用して等高線のリストを得るための関数 - BarLegend[cf,contours]は,等高線値の密度によって,色リストまたは連続スペクトルを使うことができる.
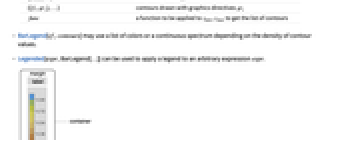
- Legended[expr,BarLegend[…]]を使って任意の式 expr に凡例を適用することができる.
- 使用可能なオプション
-
LabelStyle Automatic ラベルに使用するスタイル LegendFunction Identity 凡例全体のラッパー LegendLabel None 凡例の全体的なラベル LegendLayout Automatic 使用する凡例のレイアウト LegendMargins Automatic 凡例の内容と境界の間のスペース LegendMarkers None 各要素を示すためのマーカー LegendMarkerSize Automatic 形の大きさ - BarLegendはStandardFormでグラフィックスオブジェクトとして表示される.InputFormでは,色関数,データ範囲,等高線の値の明示的なリストとして表示される.
- BarLegendでは,LegendLayoutは次の形を取ることができる.
-
Automatic 自動的にレイアウトを決定する "Row" 凡例を水平の行に表示する "Column" 凡例を垂直の列に表示する - LineLegendでは,LegendLayoutは次の形を取ることができる.
-
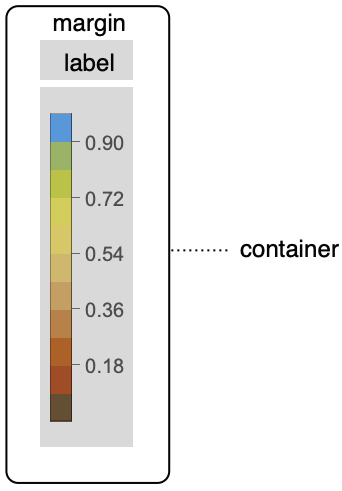
Automatic 自動的にレイアウトを決定する "Row" 凡例を水平の行に表示する "Column" 凡例を垂直の列に表示する "ReversedRow" 凡例を水平の行に逆の順で表示する "ReversedColumn" 凡例を垂直の列に逆の順で表示する - LegendFunctionは,全体的なラベルと余白を含めて,凡例に適用される.
例題
すべて開く すべて閉じる例 (7)
BarLegend["Rainbow"]BarLegend[{"DeepSeaColors", {-2, 2}}]BarLegend[{"SolarColors", {0, 1}}, 5]BarLegend[{"Rainbow", {0, 1}}]Hueを使う:
BarLegend[{Hue, {0, 1}}]GrayLevelを使う:
BarLegend[{GrayLevel, {0, 1}}]ContourPlot[Sin[x y], {x, 0, π}, {y, 0, π}, Contours -> 5, PlotLegends -> Automatic]スコープ (22)
色関数 (4)
BarLegend["AvocadoColors"]BarLegend[{"AvocadoColors", {0, 100}}]BarLegend[{{Red, Orange, Yellow, White, Green, Blue}, {-1, 1}}, {-1, -(2/3), -(1/3), 0, (1/3), (2/3), 1}]BarLegend[{{Red, Orange, Yellow, White, Green, Blue}, {-1, 1}}, 8]BarLegend[{Hue[#]&, {0, 1}}]等高線 (10)
BarLegend["LakeColors", Automatic]BarLegend["LakeColors", 5]BarLegend["LakeColors", {0.2, 0.4, 0.6, 0.8}]BarLegend["LakeColors", {Automatic, 10}]BarLegendは等高線が密なときは連続する勾配を使う:
BarLegend["LakeColors", 20]BarLegend[{"LakeColors", {0.2, 0.78}}, Automatic]fivecontours = Function[{min, max}, Range[min, max, (max - min) / 5]];BarLegend[{"Rainbow", {-2, 2}}, fivecontours]BarLegendは等高線に選択的にラベルを付ける:
ContourPlot[Sin[x]Cos[y], {x, 0, 2Pi}, {y, 0, 2Pi}, PlotLegends -> Automatic, Contours -> {Automatic, 10}]Allを使ってすべての等高線にラベルを付ける:
ContourPlot[Sin[x]Cos[y], {x, 0, 2Pi}, {y, 0, 2Pi}, PlotLegends -> BarLegend[Automatic, All], Contours -> {Automatic, 10}]Noneを使って連続的な勾配を描く:
ContourPlot[Sin[x]Cos[y], {x, 0, 2Pi}, {y, 0, 2Pi}, Contours -> {Automatic, 10}, PlotLegends -> BarLegend[Automatic, None]]プロットの凡例 (8)
密度プロットと等高線プロットはBarLegendを使う:
{DensityPlot[Cos[x y], {x, 0, π}, {y, 0, π}, PlotLegends -> Automatic], ContourPlot[Cos[x y], {x, 0, π}, {y, 0, π}, PlotLegends -> Automatic]}Placedで凡例の位置を変える:
ContourPlot[Cos[x y], {x, 0, π}, {y, 0, π}, PlotLegends -> Placed[Automatic, Below]]BarLegendは,縦横比に応じて自動的に凡例の位置と大きさを変える:
ContourPlot[Cos[x y], {x, 0, π}, {y, 0, π}, AspectRatio -> 1 / 2, ImageSize -> 200, PlotLegends -> Automatic]ContourPlot[Cos[x Sin[y]], {x, 0, π}, {y, 0, π}, AspectRatio -> 2, ImageSize -> {Automatic, 200}, PlotLegends -> Automatic]BarLegendは,自動的にColorFunctionとColorFunctionScalingの値を拾う:
ContourPlot[Cos[x y], {x, 0, π}, {y, 0, π}, ColorFunction -> "Rainbow", ColorFunctionScaling -> False, PlotLegends -> Automatic]BarLegendは等高線の値を自動的に拾う:
ContourPlot[Cos[x y], {x, 0, π}, {y, 0, π}, Contours -> {0., 0.2, 0.4, 0.6, 0.8, 1.}, PlotLegends -> Automatic]BarLegendは指定された等高線スタイルを含める:
ContourPlot[Cos[x y], {x, 0, π}, {y, 0, π}, Contours -> {0., {0.2, Red}, 0.4, {0.6, Blue}, 0.8, 1}, PlotLegends -> Automatic]BarLegendは等高線間の陰影スタイルをマッチさせる:
ContourPlot[Sin[x]Sin[y], {x, -3, 3}, {y, -3, 3}, Contours -> 3, ContourShading -> {Red, Green, Yellow, Blue}, PlotLegends -> All]BarLegendを使って自動計算された凡例のためのラベルと枠を指定する:
ContourPlot[Sin[x]Sin[y], {x, -3, 3}, {y, -3, 3}, PlotLegends -> Placed[BarLegend[Automatic, LegendMarkerSize -> 150, LegendFunction -> (Framed[#, RoundingRadius -> 5]&), LegendLabel -> "z-value"], {After, Top}]]オプション (19)
LabelStyle (3)
BarLegend[{"LakeColors", {0, 1}}, LegendLabel -> "legend"]BarLegend[{"LakeColors", {0, 1}}, LabelStyle -> Red]LabelStyleをLegendLabelに適用する:
BarLegend[{"LakeColors", {0, 1}}, LabelStyle -> Directive[Gray, FontSize -> 18, Bold], LegendLabel -> "legend"]LegendFunction (5)
BarLegend[{"LakeColors", {0, 1}}, LegendFunction -> "Frame"]BarLegend[{"LakeColors", {0, 1}}, LegendFunction -> "Panel"]container[legend_] := Tooltip[legend, "legend"]BarLegend[{"LakeColors", {0, 1}}, LegendFunction -> container]frame[legend_] := Framed[legend, FrameStyle -> Red, RoundingRadius -> 10, FrameMargins -> 10, Background -> StandardGray]BarLegend[{"LakeColors", {0, 1}}, LegendFunction -> frame]shadowbox[legend_] := Graphics[{{Gray, Rectangle[Scaled[{0.05, -0.05}], Scaled[{1.1, 0.95}]]}, {StandardBrown, EdgeForm[Gray], Rectangle[Scaled[{0, 0}], Scaled[{1, 1}]]}, Inset[legend, Scaled[{0.5, 0.5}], Center, Scaled[{1, 0.9}]]}, ImageSize -> {60, 200}, AspectRatio -> Full]BarLegend[{"LakeColors", {0, 1}}, 5, LegendFunction -> shadowbox]LegendLayout (1)
LegendLabel (5)
BarLegend[{"LakeColors", {0, 1}}, LegendLabel -> "legend"]BarLegend[{"LakeColors", {0, 1}}, LegendFunction -> "Frame", LegendLabel -> "legend"]Placedを使って枠の中に凡例ラベルを置く:
Table[BarLegend[{"LakeColors", {0, 1}}, LegendFunction -> "Frame", LegendLabel -> Placed["legend", pos]], {pos, {Left, Top, Bottom, Right}}]Placedを使って枠の外に凡例ラベルを置く:
Table[BarLegend[{"LakeColors", {0, 1}}, LegendFunction -> "Frame", LegendLabel -> Placed["legend", pos]], {pos, {Before, Above, Below, After}}]Placedの第3引数を使って凡例ラベルを回転させる:
BarLegend[{"LakeColors", {0, 1}}, LegendFunction -> "Frame", LegendLabel -> Placed["legend", Left, Rotate[#, 90Degree]&]]LegendMargins (3)
BarLegend[{"LakeColors", {0, 1}}, LegendFunction -> "Frame", LegendMargins -> 0]BarLegend[{"LakeColors", {0, 1}}, LegendFunction -> "Frame", LegendMargins -> 10]BarLegend[{"LakeColors", {0, 1}}, LegendMargins -> {{10, 0}, {20, 10}}, LegendFunction -> Framed]LegendMarkerSize (2)
BarLegend[{"LakeColors", {0, 1}}]BarLegend[{"LakeColors", {0, 1}}, 3]LegendMarkerSizeを指定する:
Table[BarLegend[{"LakeColors", {0, 1}}, LegendLayout -> "Row", LegendMarkerSize -> size], {size, {100, 200, 300}}]//Column関連するガイド
-
▪
- 凡例 ▪
- 関数の可視化 ▪
- データの可視化 ▪
- グラフのラベル,凡例,注釈付け ▪
- ラベル
テキスト
Wolfram Research (2012), BarLegend, Wolfram言語関数, https://reference.wolfram.com/language/ref/BarLegend.html.
CMS
Wolfram Language. 2012. "BarLegend." Wolfram Language & System Documentation Center. Wolfram Research. https://reference.wolfram.com/language/ref/BarLegend.html.
APA
Wolfram Language. (2012). BarLegend. Wolfram Language & System Documentation Center. Retrieved from https://reference.wolfram.com/language/ref/BarLegend.html
BibTeX
@misc{reference.wolfram_2026_barlegend, author="Wolfram Research", title="{BarLegend}", year="2012", howpublished="\url{https://reference.wolfram.com/language/ref/BarLegend.html}", note=[Accessed: 13-August-2026]}
BibLaTeX
@online{reference.wolfram_2026_barlegend, organization={Wolfram Research}, title={BarLegend}, year={2012}, url={https://reference.wolfram.com/language/ref/BarLegend.html}, note=[Accessed: 13-August-2026]}