BarLegend
更多信息和选项
- BarLegend 使用与色彩函数 cf 相关联的颜色列表来识别可视化图形或其他图例项中位于 min 和 max 之间的 contours.
- 在诸如 ContourPlot 和 ListContourPlot 等函数中,BarLegend 自动被启用.
- 在可视化函数中,BarLegend[Automatic,…] 中的 Automatic 自动由实际色彩函数、数据范围和等值线规范(用于确定等值线的值和等值线之间的颜色)取代.
- 在 BarLegend 中,contours 可以取以下形式:
-
n n 个等间距层的等值线 Automatic 自动选择等值线 All 全部等值线 None 无等值线 {Automatic,n} 至多 n 个自动选择的等值线 {f1,f2,…} 在层 fi 的等值线 {{f1,gr1},…} 由图形指令 gri 绘制的等值线 func 应用于 zmin, zmax 从而得到等值线列表的函数 - BarLegend[cf,contours] 可以使用颜色列表或取决于等值线数值的密度的连续色谱.
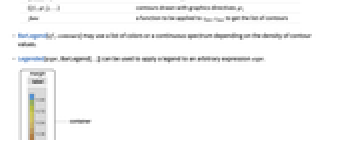
- Legended[expr,BarLegend[…]] 可用于将图例应用于任意表达式 expr.
- 可以给出以下选项:
-
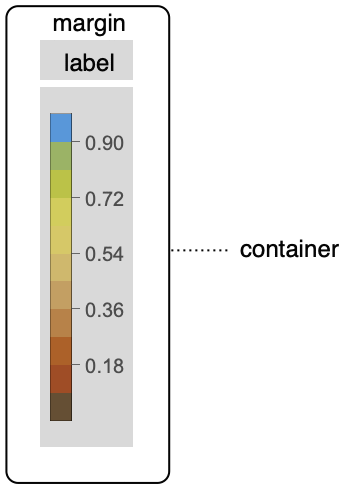
LabelStyle Automatic 标签所用的样式 LegendFunction Identity 用于全局图例的封装 LegendLabel None 图例的全局标签 LegendLayout Automatic 图例布局 LegendMargins Automatic 图例内容和边界之间的空间 LegendMarkers None 用于表示每个元素的标记 LegendMarkerSize Automatic 形状的尺寸 - BarLegend 在 StandardForm 中显示为图形对象. 在 InputForm 中,它显示为色彩函数、数据范围的等值线数值的显式列表.
- 在 BarLegend 中,LegendLayout 可取以下形式:
-
Automatic 自动确定布局 "Row" 在水平行中显示图例 "Column" 在垂直列中显示图例 - 在 LineLegend 中,LegendLayout 可取以下形式:
-
Automatic 自动确定布局 "Row" 在水平行中显示图例 "Column" 在垂直列中显示图例 "ReversedRow" 在水平行中显示逆向图例 "ReversedColumn" 在垂直列中显示逆向图例 - LegendFunction 被应用于图例,包括所有全局标签和边幅.
范例
打开所有单元 关闭所有单元基本范例 (7)
BarLegend["Rainbow"]BarLegend[{"DeepSeaColors", {-2, 2}}]BarLegend[{"SolarColors", {0, 1}}, 5]BarLegend[{"Rainbow", {0, 1}}]使用 Hue:
BarLegend[{Hue, {0, 1}}]使用 GrayLevel:
BarLegend[{GrayLevel, {0, 1}}]ContourPlot[Sin[x y], {x, 0, π}, {y, 0, π}, Contours -> 5, PlotLegends -> Automatic]范围 (22)
色彩函数 (4)
BarLegend["AvocadoColors"]BarLegend[{"AvocadoColors", {0, 100}}]BarLegend[{{Red, Orange, Yellow, White, Green, Blue}, {-1, 1}}, {-1, -(2/3), -(1/3), 0, (1/3), (2/3), 1}]BarLegend[{{Red, Orange, Yellow, White, Green, Blue}, {-1, 1}}, 8]BarLegend[{Hue[#]&, {0, 1}}]等值线 (10)
BarLegend["LakeColors", Automatic]BarLegend["LakeColors", 5]BarLegend["LakeColors", {0.2, 0.4, 0.6, 0.8}]BarLegend["LakeColors", {Automatic, 10}]当等值线密集时,BarLegend 使用连续梯度:
BarLegend["LakeColors", 20]BarLegend[{"LakeColors", {0.2, 0.78}}, Automatic]fivecontours = Function[{min, max}, Range[min, max, (max - min) / 5]];BarLegend[{"Rainbow", {-2, 2}}, fivecontours]BarLegend 有选择地标记等值线:
ContourPlot[Sin[x]Cos[y], {x, 0, 2Pi}, {y, 0, 2Pi}, PlotLegends -> Automatic, Contours -> {Automatic, 10}]使用 All 标记全部等值线:
ContourPlot[Sin[x]Cos[y], {x, 0, 2Pi}, {y, 0, 2Pi}, PlotLegends -> BarLegend[Automatic, All], Contours -> {Automatic, 10}]使用 None 绘制连续梯度:
ContourPlot[Sin[x]Cos[y], {x, 0, 2Pi}, {y, 0, 2Pi}, Contours -> {Automatic, 10}, PlotLegends -> BarLegend[Automatic, None]]图形图例 (8)
密度和等值线图使用 BarLegend:
{DensityPlot[Cos[x y], {x, 0, π}, {y, 0, π}, PlotLegends -> Automatic], ContourPlot[Cos[x y], {x, 0, π}, {y, 0, π}, PlotLegends -> Automatic]}用 Placed 改变图例位置:
ContourPlot[Cos[x y], {x, 0, π}, {y, 0, π}, PlotLegends -> Placed[Automatic, Below]]BarLegend 根据长宽比自动改变位置和大小:
ContourPlot[Cos[x y], {x, 0, π}, {y, 0, π}, AspectRatio -> 1 / 2, ImageSize -> 200, PlotLegends -> Automatic]ContourPlot[Cos[x Sin[y]], {x, 0, π}, {y, 0, π}, AspectRatio -> 2, ImageSize -> {Automatic, 200}, PlotLegends -> Automatic]BarLegend 自动选取 ColorFunction 和 ColorFunctionScaling 的值:
ContourPlot[Cos[x y], {x, 0, π}, {y, 0, π}, ColorFunction -> "Rainbow", ColorFunctionScaling -> False, PlotLegends -> Automatic]BarLegend 自动选取等值线的值:
ContourPlot[Cos[x y], {x, 0, π}, {y, 0, π}, Contours -> {0., 0.2, 0.4, 0.6, 0.8, 1.}, PlotLegends -> Automatic]BarLegend 包括指定的等值线样式:
ContourPlot[Cos[x y], {x, 0, π}, {y, 0, π}, Contours -> {0., {0.2, Red}, 0.4, {0.6, Blue}, 0.8, 1}, PlotLegends -> Automatic]BarLegend 匹配等值线之间的阴影样式:
ContourPlot[Sin[x]Sin[y], {x, -3, 3}, {y, -3, 3}, Contours -> 3, ContourShading -> {Red, Green, Yellow, Blue}, PlotLegends -> All]使用 BarLegend 给自动计算的图例指定标签和边框:
ContourPlot[Sin[x]Sin[y], {x, -3, 3}, {y, -3, 3}, PlotLegends -> Placed[BarLegend[Automatic, LegendMarkerSize -> 150, LegendFunction -> (Framed[#, RoundingRadius -> 5]&), LegendLabel -> "z-value"], {After, Top}]]选项 (19)
LabelStyle (3)
BarLegend[{"LakeColors", {0, 1}}, LegendLabel -> "legend"]BarLegend[{"LakeColors", {0, 1}}, LabelStyle -> Red]LabelStyle 应用于 LegendLabel:
BarLegend[{"LakeColors", {0, 1}}, LabelStyle -> Directive[Gray, FontSize -> 18, Bold], LegendLabel -> "legend"]LegendFunction (5)
BarLegend[{"LakeColors", {0, 1}}, LegendFunction -> "Frame"]BarLegend[{"LakeColors", {0, 1}}, LegendFunction -> "Panel"]container[legend_] := Tooltip[legend, "legend"]BarLegend[{"LakeColors", {0, 1}}, LegendFunction -> container]frame[legend_] := Framed[legend, FrameStyle -> Red, RoundingRadius -> 10, FrameMargins -> 10, Background -> StandardGray]BarLegend[{"LakeColors", {0, 1}}, LegendFunction -> frame]shadowbox[legend_] := Graphics[{{Gray, Rectangle[Scaled[{0.05, -0.05}], Scaled[{1.1, 0.95}]]}, {StandardBrown, EdgeForm[Gray], Rectangle[Scaled[{0, 0}], Scaled[{1, 1}]]}, Inset[legend, Scaled[{0.5, 0.5}], Center, Scaled[{1, 0.9}]]}, ImageSize -> {60, 200}, AspectRatio -> Full]BarLegend[{"LakeColors", {0, 1}}, 5, LegendFunction -> shadowbox]LegendLayout (1)
LegendLabel (5)
BarLegend[{"LakeColors", {0, 1}}, LegendLabel -> "legend"]BarLegend[{"LakeColors", {0, 1}}, LegendFunction -> "Frame", LegendLabel -> "legend"]使用 Placed 在边框内部放置图例标签:
Table[BarLegend[{"LakeColors", {0, 1}}, LegendFunction -> "Frame", LegendLabel -> Placed["legend", pos]], {pos, {Left, Top, Bottom, Right}}]使用 Placed 在边框外部放置图例标签:
Table[BarLegend[{"LakeColors", {0, 1}}, LegendFunction -> "Frame", LegendLabel -> Placed["legend", pos]], {pos, {Before, Above, Below, After}}]在 Placed 中使用第三个参数旋转图例标签:
BarLegend[{"LakeColors", {0, 1}}, LegendFunction -> "Frame", LegendLabel -> Placed["legend", Left, Rotate[#, 90Degree]&]]LegendMargins (3)
BarLegend[{"LakeColors", {0, 1}}, LegendFunction -> "Frame", LegendMargins -> 0]BarLegend[{"LakeColors", {0, 1}}, LegendFunction -> "Frame", LegendMargins -> 10]BarLegend[{"LakeColors", {0, 1}}, LegendMargins -> {{10, 0}, {20, 10}}, LegendFunction -> Framed]LegendMarkerSize (2)
BarLegend[{"LakeColors", {0, 1}}]BarLegend[{"LakeColors", {0, 1}}, 3]指定 LegendMarkerSize:
Table[BarLegend[{"LakeColors", {0, 1}}, LegendMarkerSize -> size], {size, {100, 200, 300}}]//Row相关指南
-
▪
- 图例 ▪
- 函数可视化 ▪
- 数据可视化 ▪
- 图表标签、图例和注解 ▪
- 标签
文本
Wolfram Research (2012),BarLegend,Wolfram 语言函数,https://reference.wolfram.com/language/ref/BarLegend.html.
CMS
Wolfram 语言. 2012. "BarLegend." Wolfram 语言与系统参考资料中心. Wolfram Research. https://reference.wolfram.com/language/ref/BarLegend.html.
APA
Wolfram 语言. (2012). BarLegend. Wolfram 语言与系统参考资料中心. 追溯自 https://reference.wolfram.com/language/ref/BarLegend.html 年
BibTeX
@misc{reference.wolfram_2026_barlegend, author="Wolfram Research", title="{BarLegend}", year="2012", howpublished="\url{https://reference.wolfram.com/language/ref/BarLegend.html}", note=[Accessed: 10-August-2026]}
BibLaTeX
@online{reference.wolfram_2026_barlegend, organization={Wolfram Research}, title={BarLegend}, year={2012}, url={https://reference.wolfram.com/language/ref/BarLegend.html}, note=[Accessed: 10-August-2026]}