


MoleculePlot
MoleculePlot[mol]
creates a two-dimensional structure diagram of the molecule mol.
MoleculePlot[mol,patt]
creates a diagram of mol where all atoms and bonds matching the pattern patt are highlighted.
Details and Options
- MoleculePlot returns a Graphics expression.
- If the molecule does not have structure diagram coordinates, they will be generated automatically.
- mol can be a Molecule object or something that can be easily converted to one, such as a systematic chemical name, a "Chemical" entity, a BioSequence or an ExternalIdentifier.
- MoleculePlot[MoleculePattern[…]] will return a depiction of the given molecule pattern.
- Possible forms for patt include:
-
n the index of a particular atom Atom[…] a pattern for an atom Bond[…] a pattern for a bond MoleculePattern[…] a pattern for a molecule substructure {patt1,patt2,…} a list of patterns <label1patt1,…> an Association of labels and patterns - MoleculePlot has the same options as Graphics, with the following additions and changes: [List of all options]
-
AtomLabels Automatic labels and label placements for atoms AtomLabelStyle Automatic style to use for atom labels BondLabels None labels and label placements for bonds BondLabelStyle Automatic style to use for bond labels ColorRules Automatic a list of rules {elem1->col1,…} dictating which colors to use for atomic elements IncludeHydrogens Automatic whether to show hydrogen atoms PlotLegends None legends for highlights PlotTheme $PlotTheme overall theme for the plot - Supported plot themes include:
-
"AllAtom" display all hydrogens 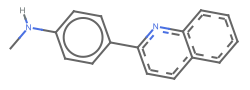
"Aromatic" aromatic bonds are shown as dashed lines or circles 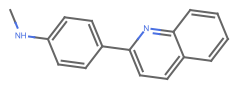
"HeavyAtom" hydrogen atoms are elided or combined with the connected heavy atom 
"Monochrome" all text and graphics are shown in black 
"ACS" monochrome with larger atomic symbols - Typical settings for PlotLegends include:
-
None no legend Automatic automatically determine legend {lbl1,lbl2,…} use lbl1, lbl2, … as legend labels Placed[lspec,…] specify placement for legend
List of all options
Examples
open all close allBasic Examples (2)
Create a molecule and plot it:
MoleculePlot[Molecule["NC(=O)C[C@H](C(=O)O)N"]]Highlight the first and third atoms:
MoleculePlot[Molecule["NC(=O)C[C@H](C(=O)O)N"], {3, 8}]MoleculePlot[Molecule["NC(=O)C[C@H](C(=O)O)N"], Atom["O"]]Highlight two different patterns:
MoleculePlot["O=C(C1CCC1)S[C@@H]1CCC1(C)C", <|"carbonyl" -> Bond[{"C", "O"}, "Double"], "ring carbons" -> Atom["C", "RingAtomQ" -> True]|>]Scope (2)
A pattern can match one or multiple positions in a molecule:
m = Molecule[{Atom["C"], Atom["C"], Atom["C"], Atom["O"], Atom["N"], Atom["C"], Atom["O"], Atom["N"],
  Atom["C"], Atom["C"], Atom["C"], Atom["O"], Atom["O"], Atom["C"], Atom["N"], Atom["C"],
  Atom["C"], Atom["O"], Atom["O"], Atom["C"], Atom["C"], A ... er" -> 10, "Direction" -> "Clockwise", "FiducialAtom" -> 9,
    "Ligands" -> {11, 5, 34}], Association["StereoType" -> "Tetrahedral", "ChiralCenter" -> 16,
    "Direction" -> "Counterclockwise", "FiducialAtom" -> 15, "Ligands" -> {17, 20, 40}]}];
carbonylPattern = Bond[{"C", "O"}, "Double"];
Highlight each carbonyl separately:
MoleculePlot[m, carbonylPattern]Highlight each carbonyl as a single color:
MoleculePlot[m, {carbonylPattern}]m = Molecule[{Atom["C"], Atom["N"], Atom["C"], Atom["C"], Atom["C"], Atom["N"], Atom["C"], Atom["O"],
Atom["C"], Atom["C"], Atom["C"], Atom["C"], Atom["H"], Atom["H"], Atom["H"], Atom["H"],
Atom["H"], Atom["H"], Atom["H"], Atom["H"], Atom["H"], A ... e"],
Bond[{6, 22}, "Single"], Bond[{10, 23}, "Single"], Bond[{10, 24}, "Single"],
Bond[{11, 25}, "Single"], Bond[{11, 26}, "Single"], Bond[{11, 27}, "Single"],
Bond[{12, 28}, "Single"], Bond[{12, 29}, "Single"], Bond[{12, 30}, "Single"]}];MoleculePlot[m, {1, Bond[{"C", "C"}, "Double"]}]Options (35)
AtomLabels (1)
Label all atoms by their index:
MoleculePlot[Molecule["2,3-dichloro-4-nitro-1H-pyrrole"], AtomLabels -> "AtomIndex"]Label only chlorine atoms by their index:
MoleculePlot[Molecule["2,3-dichloro-4-nitro-1H-pyrrole"], AtomLabels -> {Atom["Cl"] -> "AtomIndex"}]Label non-hydrogen atoms by their hybridization:
MoleculePlot[Molecule["2,3-dichloro-4-nitro-1H-pyrrole"], AtomLabels -> {Atom[Except["H"]] -> MoleculeProperty["OrbitalHybridization"]}]AtomLabelStyle (1)
Set all labels to have the same style:
MoleculePlot[Molecule["2,3-dichloro-4-nitro-1H-pyrrole"], AtomLabels -> "AtomIndex", AtomLabelStyle -> Directive[FontSize -> 12, Blue]]Set the label style depending on atom type:
MoleculePlot[Molecule["2,3-dichloro-4-nitro-1H-pyrrole"], AtomLabels -> "AtomIndex", AtomLabelStyle -> {Atom["C"] -> Directive[12, Blue], Atom["O"] -> Directive[8, Purple, Bold], _ -> Italic}]BondLabels (1)
Label all bonds by their index:
MoleculePlot[Molecule["2,3-dichloro-4-nitro-1H-pyrrole"], BondLabels -> "BondIndex"]Label only bonds to chlorine atoms by their bond type:
MoleculePlot[Molecule["2,3-dichloro-4-nitro-1H-pyrrole"], BondLabels -> {Bond[{"Cl", _}] -> MoleculeProperty["BondType"]}]BondLabelStyle (1)
Give all bond labels the same style:
MoleculePlot[Molecule["2,3-dichloro-4-nitro-1H-pyrrole"], BondLabels -> "BondIndex", BondLabelStyle -> Directive[FontSize -> 22, Red]]Label bonds differently based on their atoms:
MoleculePlot[Molecule["2,3-dichloro-4-nitro-1H-pyrrole"], BondLabels -> "BondIndex", BondLabelStyle -> {Bond[{"N", _}] -> Directive[FontSize -> 22, Red], Bond[{"Cl", _}] -> Directive[FontSize -> 22, Blue]}]AspectRatio (4)
By default, the ratio of the height to width for the plot is determined automatically:
MoleculePlot[Molecule[{"O", "H", "H"}, {Bond[{1, 2}, "Single"], Bond[{1, 3}, "Single"]}]]Make the height the same as the width with AspectRatio1:
MoleculePlot[Molecule[{"O", "H", "H"}, {Bond[{1, 2}, "Single"], Bond[{1, 3}, "Single"]}], AspectRatio -> 1]Use numerical values to specify the height-to-width ratio:
MoleculePlot[Molecule[{"O", "H", "H"}, {Bond[{1, 2}, "Single"], Bond[{1, 3}, "Single"]}], AspectRatio -> 1 / GoldenRatio]AspectRatioFull adjusts the height and width to tightly fit inside other constructs:
plot = MoleculePlot[Molecule[{"O", "H", "H"}, {Bond[{1, 2}, "Single"], Bond[{1, 3}, "Single"]}], AspectRatio -> Full];{Framed[Pane[plot, {50, 100}]], Framed[Pane[plot, {100, 100}]], Framed[Pane[plot, {100, 50}]]}Axes (4)
By default, Axes are not drawn:
MoleculePlot[Molecule[{"O", "H", "H"}, {Bond[{1, 2}, "Single"], Bond[{1, 3}, "Single"]}]]Use AxesTrue to turn on axes:
MoleculePlot[Molecule[{"O", "H", "H"}, {Bond[{1, 2}, "Single"], Bond[{1, 3}, "Single"]}], Axes -> True]Use AxesOrigin to specify where the axes intersect:
MoleculePlot[Molecule[{"O", "H", "H"}, {Bond[{1, 2}, "Single"], Bond[{1, 3}, "Single"]}], Axes -> True, AxesOrigin -> {1.6, 0.7}]Turn on each axis individually:
{MoleculePlot[Molecule[{"O", "H", "H"}, {Bond[{1, 2}, "Single"], Bond[{1, 3}, "Single"]}], Axes -> {True, False}], MoleculePlot[Molecule[{"O", "H", "H"}, {Bond[{1, 2}, "Single"], Bond[{1, 3}, "Single"]}], Axes -> {False, True}]}AxesLabel (3)
No axes labels are drawn by default:
MoleculePlot[Molecule[{"O", "H", "H"}, {Bond[{1, 2}, "Single"], Bond[{1, 3}, "Single"]}], Axes -> True]MoleculePlot[Molecule[{"O", "H", "H"}, {Bond[{1, 2}, "Single"], Bond[{1, 3}, "Single"]}], Axes -> True, AxesLabel -> y]MoleculePlot[Molecule[{"O", "H", "H"}, {Bond[{1, 2}, "Single"], Bond[{1, 3}, "Single"]}], Axes -> True, AxesLabel -> {x, y}]AxesOrigin (2)
The position of the axes is determined automatically:
MoleculePlot[Molecule[{"O", "H", "H"}, {Bond[{1, 2}, "Single"], Bond[{1, 3}, "Single"]}], Axes -> True]Specify an explicit origin for the axes:
MoleculePlot[Molecule[{"O", "H", "H"}, {Bond[{1, 2}, "Single"], Bond[{1, 3}, "Single"]}], Axes -> True, AxesOrigin -> {.6, .3}]AxesStyle (4)
Change the style for the axes:
MoleculePlot[Molecule[{"O", "H", "H"}, {Bond[{1, 2}, "Single"], Bond[{1, 3}, "Single"]}], Axes -> True, AxesStyle -> Red]Specify the style of each axis:
MoleculePlot[Molecule[{"O", "H", "H"}, {Bond[{1, 2}, "Single"], Bond[{1, 3}, "Single"]}], Axes -> True, AxesStyle -> {{Thick, Red}, {Thick, Blue}}]Use different styles for the ticks and the axes:
MoleculePlot[Molecule[{"O", "H", "H"}, {Bond[{1, 2}, "Single"], Bond[{1, 3}, "Single"]}], Axes -> True, AxesStyle -> Green, TicksStyle -> Black]Use different styles for the labels and the axes:
MoleculePlot[Molecule[{"O", "H", "H"}, {Bond[{1, 2}, "Single"], Bond[{1, 3}, "Single"]}], Axes -> True, AxesStyle -> Green, LabelStyle -> Black]ColorRules (1)
IncludeHydrogens (1)
Frame (4)
By default, MoleculePlot does not use a frame:
MoleculePlot[Molecule["2,3-dichloro-4-nitro-1H-pyrrole"]]Use FrameTrue to draw a frame around the plot:
MoleculePlot[Molecule["2,3-dichloro-4-nitro-1H-pyrrole"], Frame -> True]Draw a frame on the left and right edges:
MoleculePlot[Molecule["2,3-dichloro-4-nitro-1H-pyrrole"], Frame -> {{True, True}, {False, False}}]Draw a frame on the left and bottom edges:
MoleculePlot[Molecule["2,3-dichloro-4-nitro-1H-pyrrole"], Frame -> {{True, False}, {True, False}}]FrameLabel (4)
Place a label along the bottom frame of a plot:
MoleculePlot[Molecule["2,3-dichloro-4-nitro-1H-pyrrole"], Frame -> True, FrameLabel -> {"label"}]Frame labels are placed on the bottom and left frame edges by default:
MoleculePlot[Molecule["2,3-dichloro-4-nitro-1H-pyrrole"], Frame -> True, FrameLabel -> {"bottom", "left"}]Place labels on each of the edges in the frame:
MoleculePlot[Molecule["2,3-dichloro-4-nitro-1H-pyrrole"], Frame -> True, FrameLabel -> {{"left", "right"}, {"bottom", "top"}}]Use a customized style for both labels and frame tick labels:
MoleculePlot[Molecule["2,3-dichloro-4-nitro-1H-pyrrole"], Frame -> True, FrameLabel -> {{"left", "right"}, {"bottom", "top"}}, LabelStyle -> Directive[Bold, Black]]ImageSize (2)
Use named sizes, such as Tiny, Small, Medium and Large:
{MoleculePlot[Molecule[{"O", "H", "H"}, {Bond[{1, 2}, "Single"], Bond[{1, 3}, "Single"]}], ImageSize -> Tiny], MoleculePlot[Molecule[{"O", "H", "H"}, {Bond[{1, 2}, "Single"], Bond[{1, 3}, "Single"]}], ImageSize -> Small]}Specify the width of the plot:
{MoleculePlot[Molecule[{"O", "H", "H"}, {Bond[{1, 2}, "Single"], Bond[{1, 3}, "Single"]}], ImageSize -> 150], MoleculePlot[Molecule[{"O", "H", "H"}, {Bond[{1, 2}, "Single"], Bond[{1, 3}, "Single"]}], ImageSize -> 250]}PlotLegends (1)
Use placeholders for plot legends:
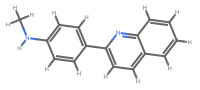
m = Molecule[{Atom["C"], Atom["N"], Atom["C"], Atom["C"], Atom["C"], Atom["N"], Atom["C"], Atom["O"],
  Atom["C"], Atom["C"], Atom["C"], Atom["C"], Atom["H"], Atom["H"], Atom["H"], Atom["H"],
  Atom["H"], Atom["H"], Atom["H"], Atom["H"], Atom["H"], A ...
  Bond[{6, 22}, "Single"], Bond[{10, 23}, "Single"], Bond[{10, 24}, "Single"],
  Bond[{11, 25}, "Single"], Bond[{11, 26}, "Single"], Bond[{11, 27}, "Single"],
Bond[{12, 28}, "Single"], Bond[{12, 29}, "Single"], Bond[{12, 30}, "Single"]}, {}];MoleculePlot[m, {1, Bond[{"C", "C"}, "Double"]}, PlotLegends -> Automatic]Use the expressions to label the highlights:
MoleculePlot[m, {1, Bond[{"C", "C"}, "Double"]}, PlotLegends -> Placed["Expressions", Below]]PlotTheme (1)
By default, aromatic bonds are shown in their delocalized Kekule form. Use the "Aromatic" plot theme to show which bonds are aromatic. Phenyl rings are shown with a circle to indicate the delocalized bonding electrons. Aromatic heterocycles use dashed lines for aromatic bonds:
MoleculePlot["Nc1nccc(n1)c1c(C)onc1c1ccccc1", PlotTheme -> "Aromatic"]Combine different plot themes:
MoleculePlot["Nc1nccc(n1)c1c(C)onc1c1ccccc1", PlotTheme -> {"Aromatic", "AllAtom", "Monochrome"}]Create a plot suitable for a journal figure:
MoleculePlot["Nc1nccc(n1)c1c(C)onc1c1ccccc1", PlotTheme -> "ACS"]Text
Wolfram Research (2019), MoleculePlot, Wolfram Language function, https://reference.wolfram.com/language/ref/MoleculePlot.html (updated 2021).
CMS
Wolfram Language. 2019. "MoleculePlot." Wolfram Language & System Documentation Center. Wolfram Research. Last Modified 2021. https://reference.wolfram.com/language/ref/MoleculePlot.html.
APA
Wolfram Language. (2019). MoleculePlot. Wolfram Language & System Documentation Center. Retrieved from https://reference.wolfram.com/language/ref/MoleculePlot.html