

SpatialPointData
SpatialPointData[points]
represents a collection of spatial locations points.
SpatialPointData[points,reg]
represents a collection of points within the region reg.
SpatialPointData[pointsvals,…]
associates the values vals with the location points.
SpatialPointData[points<key1vals1,…>,…]
associates the key-value annotations keyivalsi.
SpatialPointData[{p1data1,p2data2,…},…]
represents the spatial point collection {p1,p2,…} with associated values {data1,data2,…}.
SpatialPointData[{points1,points2,…},…]
represents multiple collections of spatial points.
SpatialPointData[{points1anns1,points2anns2,…},…]
represents multiple collections of spatial points with annotations.
Details and Options
- Spatial point collections are also known as spatial point patterns.
- A spatial point configuration is a collection of points, together with the observation region reg and optional annotations for each point.
- Point configurations can be in any dimension. Typical 1D points are events in time such as customer arrivals or server job arrivals. Typical 2D points are locations of cells in a sample, tree locations, crime or disease locations, etc. Typical 3D points are locations of stars and galaxy clusters or locations of aggregates in concrete, or locations of defects in materials.
-
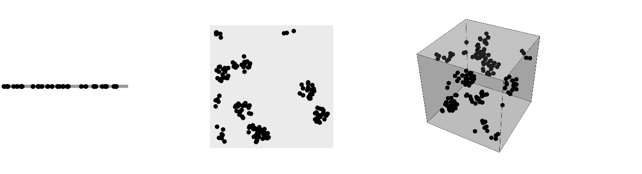
- The points points can have the following forms:
-
{p1,p2,…} geometric points pi∈d GeoPosition[…],GeoPositionXYZ[…],… geographic points - The observation region reg is important if correct statistics are to be generated about the point configuration.
-
- If the observation region reg is not given, a region is automatically computed using RipleyRassonRegion.
- The observation region reg should be a parameter-free, full-dimensional and bounded region as tested by SpatialObservationRegionQ.
- Spatial points can also come with annotations that provide additional information related to each point. These are usually termed marks and covariates.
- Typical marks include tree diameter at breast height and tree species, and a typical covariate would be elevation in the case of trees.
- Annotation properties include:
-
"Annotations" annotations for the first point configuration {"Annotations",n} annotations for the nth point configuration "AnnotationsList" list of annotations for all point configurations {…,"key"} returns annotations with the given key "key" - Annotations can be retrieved and added using functions like AnnotationKeys, Annotate, AnnotationValue, etc.
- Basic properties include:
-
"Summary" data information table "Dimension" dimensionality of point coordinates "ObservationRegion" observation region "RegionMeasure" measure of the observation region "ConfigurationCount" number of point configurations "Points" point coordinates of the first configuration "PointsList" point coordinates of all configurations "PointCount" number of points in the first point configuration "PointCountList" number of points in all point configurations "MeanPointCount" mean point count across all point configurations "MeanPointDensity" mean point density across all point configurations "FryPlot" directional scatter plot - SpatialPointData[sdata,newreg] creates a subset of the original spatial point data, with a new observation region being the intersection of newreg and the original observation region.
- SpatialPointData can be used with functions such as HistogramPointDensity, RipleyK and SpatialRandomnessTest.
Examples
open all close allBasic Examples (2)
Create a univariate SpatialPointData:
SpatialPointData[RandomReal[1, {10, 1}]]NumberLinePlot[%]Multivariate SpatialPointData:
SpatialPointData[RandomReal[1, {20, 2}]]ListPlot[%]Create a SpatialPointData for a list of GeoPosition:
data = {Entity["City", {"Houston", "Texas", "UnitedStates"}], Entity["City", {"Austin", "Texas", "UnitedStates"}], Entity["City", {"Dallas", "Texas", "UnitedStates"}], Entity["City", {"SanAntonio", "Texas", "UnitedStates"}]};Specify region as the state of Texas:
tx = Entity["AdministrativeDivision", {"Texas", "UnitedStates"}];spd = SpatialPointData[data, tx]GeoListPlot[spd, GeoRange -> tx]Scope (22)
Basic Uses (8)
Create univariate spatial point data over an interval:
reg = Interval[{0, 1}];sample = RandomVariate[BetaDistribution[2, 1 / 3], 10 ^ 3];spd = SpatialPointData[Partition[sample, 1], reg]NumberLinePlot[spd, PlotStyle -> PointSize[Tiny]]Create a 2D spatial point from random points in a disk:
res = Disk[{0, 1}, 4];sample = RandomPoint[res, 10 ^ 3];spd = SpatialPointData[sample, res]ListPlot[spd, AspectRatio -> 1]points = N@PolyhedronData["Dodecahedron", "Vertices"];spd = SpatialPointData[points, PolyhedronData["Dodecahedron", "MeshRegion"]]The data points and the region:
Show[spd["ObservationRegion"], Graphics3D[{Black, PointSize[.035], Point[points]}]]Identify a hardcore radius by plotting the vectors between all pairs of different data points:
sample = RandomPointConfiguration[HardcorePointProcess[10 ^ 4, .1, 2], Rectangle[]]The plot of the vectors is called a Fry plot, and can be extracted directly from the spatial point data:
sample["FryPlot"]Construct SpatialPointData with random geodetic points:
geodata = RandomGeoPosition["World", 100]data = SpatialPointData[geodata, GeoBoundsRegion[{{-90, 90}, {-180, 180}}]]GeoListPlot[data]Extract the locations of the largest cities in the United States:
cities = Entity["Country", "UnitedStates"]["LargestCities"];Create SpatialPointData with the region specified by the country polygon:
data = SpatialPointData[cities, Entity["Country", "UnitedStates"]]Plot the locations of the cities:
GeoListPlot[data]Obtain a regular grid over Mexico using GeoElevationData:
data = GeoElevationData[Entity["Country", "Mexico"], Automatic, "GeoPosition", GeoZoomLevel -> 1]The grid points are given in the form of an array:
First[data]//DimensionsFlatten to obtain a list of points with elevations:
points = MapAt[Flatten[#, 1]&, data, 1]spd = SpatialPointData[points -> <|"Elevation" -> points["Elevation"]|>, Entity["Country", "Mexico"]]GeoListPlot[spd]Obtain data from a ResourceObject:
obj = ResourceObject["Sample Data: Lansing Woods"]data = ResourceData[obj]ListPlot[data]Region (3)
SpatialPointData is defined with respect to an observation region in which the points occur:
points = RandomReal[1, {3, 10, 2}];spd = SpatialPointData[points, Rectangle[]]spd["Properties"]spd["ObservationRegion"]Only the points within the specified observation region are retained:
new = SpatialPointData[points, Rectangle[{0, 0}, {.5, .5}]]new["ObservationRegion"]If the observation region is not specified, it is estimated with the Ripley–Rasson estimator (a dilation of the convex hull):
spd = SpatialPointData[RandomReal[1, {100, 2}]]Visualize the estimated region together with the points:
Show[RegionPlot[spd["ObservationRegion"]], ListPlot[spd]]Create new spatial point data by intersecting it with another region:
pts = RandomReal[1, {10, 2}];
spd = SpatialPointData[pts, Rectangle[{0, 0}, {1, 1}]];newreg1 = Rectangle[{0, 0}, {2, .5}];spd1 = SpatialPointData[spd, newreg1];spd1["ObservationRegion"]RegionPlot[{spd["ObservationRegion"], newreg1, spd1["ObservationRegion"]}, PlotLegends -> {"original observation region", "newreg1", "new observation region"}]Create new spatial point data with a larger new region by reconstruction:
newreg2 = Rectangle[{0, 0}, {1, 2}];spd2 = SpatialPointData[spd["Points"], newreg2]The new observation region is exactly the new region given:
spd2["ObservationRegion"]spd2["ObservationRegion"] === newreg2RegionPlot[{spd["ObservationRegion"], newreg2}, PlotLegends -> {"original observation region", "new observation region"}]Transformations (3)
Translate SpatialPointData:
spd = SpatialPointData[RandomReal[{-1, 1}, {100, 2}], Disk[]]Define and apply a translation transform:
fn = TranslationTransform[{2, .5}];
spd1 = fn[spd];
Plot the original data and region with the transformed results:
Show[RegionPlot[{spd["ObservationRegion"], spd1["ObservationRegion"]}, PlotLegends -> {"Original Region", "Transformed Region"}], ListPlot[{spd["Points"], spd1["Points"]}], AspectRatio -> Automatic]Rotate SpatialPointData:
spd = SpatialPointData[RandomReal[2, {100, 2}], Rectangle[{0, 0}, {2, 1}]]Define and apply a rotating transform:
fn = RotationTransform[π / 2];
spd1 = fn[spd]
Plot the original data and region with the transformed results:
Show[RegionPlot[{spd["ObservationRegion"], spd1["ObservationRegion"]}, PlotLegends -> {"Original Region", "Transformed Region"}], ListPlot[{spd["Points"], spd1["Points"]}], AspectRatio -> Automatic]Rescale SpatialPointData:
spd = SpatialPointData[RandomReal[1, {100, 2}]]Define and apply a scaling transform:
fn = ScalingTransform[{1 / 2, 2 / 3}];
spd1 = fn[spd]
Plot the original data and region with the transformed results:
Show[RegionPlot[{spd["ObservationRegion"], spd1["ObservationRegion"]}, PlotLegends -> {"Original Region", "Transformed Region"}], ListPlot[{spd["Points"], spd1["Points"]}], AspectRatio -> Automatic]Annotations (6)
Extract the names and locations of the largest cities in Ireland:
{names, pos} = Transpose[EntityValue[Entity["Country", "Ireland"]["LargestCities"], {"Name", "Position"}]];Specify the region to be the country polygon:
data = SpatialPointData[GeoPosition[pos] -> <|"Name" -> names|>]data[{"Annotations", "Name"}]Annotations can be also accessed using specific annotation functions:
AnnotationKeys[data]Extract the values for a given key:
AnnotationValue[data, "Name"]Plot the data with the names in tooltips:
loc = MapThread[Tooltip[#1, #2]&, {Thread@pos, names}];
GeoListPlot[loc, GeoRange -> Entity["Country", "Ireland"]["Polygon"]]
Add both categorical and numeric annotations to a point pattern:
data = {{41.69, 28.88}, {3.61, 16.75}, {493.6, 158.08}, {172.3, 52.17}, {509.57, 460.5}, {241.47, 82.14}, {299.61, 286.61}, {7.28, 387.6}, {429.98, 92.94}, {142.01, 195.63}};
annotations = { {"on", "off", "on", "on", "off", "off", "on", "on", "off", "off"}, {275.9, 241.2, 256., 442.9, 209.4, 260.4, 348.8, 315.2, 275.3, 317.8}};spd = SpatialPointData[data -> annotations]spd["Annotations"]Annotations are automatically labeled:
spd[{"Annotations", "Keys"}]Plot data with the annotations:
Show[spd["ObservationRegion"], PointValuePlot[spd, PlotLegends -> Automatic]]Provide explicit keys for the annotations:
data = {{41.69, 28.88}, {3.61, 16.75}, {493.6, 158.08}, {172.3, 52.17}, {509.57, 460.5}, {241.47, 82.14}, {299.61, 286.61}, {7.28, 387.6}, {429.98, 92.94}, {142.01, 195.63}};
status = {"on", "off", "on", "on", "off", "off", "on", "on", "off", "off"};areas = {275.9, 241.2, 256., 442.9, 209.4, 260.4, 348.8, 315.2, 275.3, 317.8};spd = SpatialPointData[data -> <|"Cell Status" -> status, "Area" -> areas|>]Extract the keys of annotations:
spd[{"Annotations", "Keys"}]spd["Annotations"]Extract a particular annotation:
spd[{"Annotations", "Cell Status"}]spd[{"Annotations", "Area"}]Define spatial point data with multiple annotations of each type:
data = {{41.69, 28.88}, {3.61, 16.75}, {493.6, 158.08}, {172.3, 52.17}, {509.57, 460.5}, {241.47, 82.14}, {299.61, 286.61}, {7.28, 387.6}, {429.98, 92.94}, {142.01, 195.63}};
status = {"on", "off", "on", "on", "off", "off", "on", "on", "off", "off"};
types = RandomChoice[{"S", "R", "W"}, 10];areas = {275.9, 241.2, 256., 442.9, 209.4, 260.4, 348.8, 315.2, 275.3, 317.8};
thick = {1.2, 4.3, 1.5, 2.3, .9, .13, .98, .34, .7, 1.3};spd = SpatialPointData[data -> <|"Cell Status" -> status, "Area" -> areas, "Type" -> types, "Thicknes" -> thick|>]Annotation keys are shown in the summary:
spd["Summary"]Assign annotations to a subset of the pattern using SparseArray:
spd = SpatialPointData[RandomReal[1, {100, 2}] -> SparseArray[Thread[RandomChoice[Range[100], 20] -> 1], 100]]spd["Annotations"]ListPlot[spd["Annotations"][1]]Add annotations to spatial data defined with GeoPosition:
geodata = GeoPosition@
	Transpose[{RandomReal[{-80, 80}, 10], RandomReal[{-180, 180}, 10]}];
annotations = { "status" -> {"on", "off", "on", "on", "off", "off", "on", "on", "off", "off"}, "value" -> {275.9, 241.2, 256., 442.9, 209.4, 260.4, 348.8, 315.2, 275.3, 317.8}};spd = SpatialPointData[geodata -> annotations, GeoBoundsRegion[{{-90, 90}, {-180, 180}}]]spd[{"Annotations"}]Visualize the points with annotations:
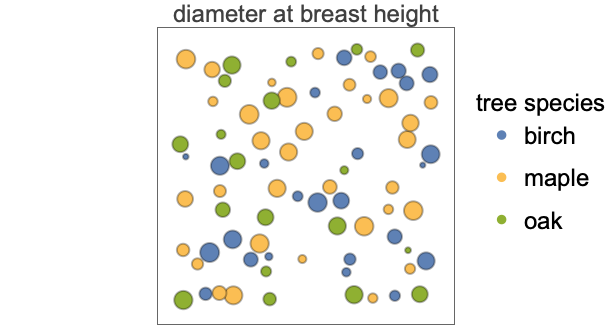
PointValuePlot[spd, {1 -> "Shape", 2 -> "Size"}, ColorFunction -> "BlueGreenYellow", PlotLegends -> Automatic]Configurations (2)
Create spatial point data with two point configurations and different annotations:
pts = RandomReal[1, {10, 2}];
reg = Rectangle[{0, 0}, {1, 1}];colors = RandomChoice[ColorData[97, "ColorList"], 10];
diameters = {.1, .1, .1, .2, .2, .2, .3, .3, .3, .3};spd = SpatialPointData[{pts -> {"color" -> colors, "diameter" -> diameters}, pts -> {"index" -> Range[10]}}, reg]Select first point configuration only:
spd[{"Configuration", 1}]%["Summary"]Create new spatial point data by reversing the order of point configurations:
spd[{"Configuration", {2, 1}}]%["Summary"]Create copies of point configurations:
spd[{"Configuration", {1, 2, 1}}]%["Summary"]Extract all the point configurations as individual SpatialPointData objects:
spd = SpatialPointData[{RandomReal[1, {10, 2}], RandomReal[1, {12, 2}], RandomReal[1, {19, 2}]}]spd["ConfigurationList"]Applications (8)
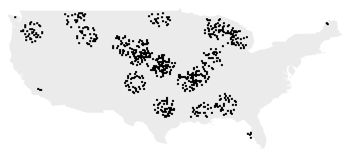
Locations of breweries in the US:
data = GeoPosition[«1»];The data contains locations from Alaska and Hawaii:
GeoGraphics[Point[data]]Create SpatialPointData with breweries in contiguous US only:
spd = SpatialPointData[data, EntityValue[GeoVariant[Entity["Country", "UnitedStates"], "DefaultMapArea"], "Polygon"]]GeoGraphics[Point[spd]]img = [image];ImageMeasurements[img, "Dimensions"]data = SpatialPointData[ImageKeypoints[img]]Show[img, RegionPlot[data["ObservationRegion"]], ListPlot[data, PlotStyle -> Red], AspectRatio -> Divide@@Most[ImageMeasurements[img, "Dimensions"]]]Operating nuclear reactors in the world:
data = SpatialPointData[GeoPosition[EntityClass["NuclearReactor", "Operational"]["Position"]] -> {"Name" -> EntityClass["NuclearReactor", "Operational"]["Name"]}, GeoBoundsRegion[{{-90, 90}, {-180, 180}}]]GeoListPlot[data]The locations of 58 US national parks:
parks = {...};parks//LengthExtract positions from Wikipedia:
pos = Map[WikipediaData[#, "GeoPosition"]&, parks];Latitude and longitude bounds:
lat = MinMax[pos[[All, 1, 1]]]lon = MinMax[pos[[All, 1, 2]]]region = GeoBoundsRegion[{lat, lon}]Define SpatialPointData:
USparks = SpatialPointData[GeoPosition[pos], region]Plot the national parks on a map:
PointValuePlot[USparks, Axes -> False, PlotStyle -> Yellow, GeoBackground -> GeoStyling["Satellite", Opacity[.8]], AspectRatio -> .75]US national park data of positions and areas:
parks = SpatialPointData[GeoPosition[{{44.35, -68.21666667}, {38.68333, -109.56667}, {43.75, -102.5}, {29.25, -103.25},
  {25.46944444, -80.18611111}, {38.56666667, -107.71666667}, {37.6283, -112.16766},
  {38.16691, -109.75966}, {38.2, -111.16666667}, {32.17527778, -104 ... 89}, {32.25, -110.5},
  {36.56471, -118.77337}, {38.53333333, -78.35}, {46.96666667, -103.45},
  {18.33333333, -64.73333333}, {48.5, -92.88333333}, {43.55635, -103.47865}, {61, -142},
  {44.6, -110.5}, {37.85, -119.55}, {37.20262, -112.98785}}] -> {"Area" -> StructuredArray[QuantityArray, {58}, StructuredArray`StructuredData[QuantityArray,
  {74.04950209409239, 119.31513925749647, 381.2635262915919, 1251.8616004686503,
   270.27677625484813, 48.04857964535431, 55.99417403548851, 527.5153243204484, 37 ... 2.88006903320968, 631.3503886270221,
   310.97509513103995, 110.07890532864783, 22.95237679384096, 340.72146295896226,
   44.212506050904075, 20588.075726757837, 3468.5433678823215, 1189.5203262536681,
   229.06750175120817}, "Miles"^2, {{1}}]], "Name" -> {...}}]
Explore the available annotations:
AnnotationKeys[parks]Visualize the area of each park:
PointValuePlot[parks, "Size"]Illinois rest areas with location and status information:
data = SpatialPointData[GeoPosition[{{41.393745, -89.566491}, {41.393737, -89.559088}, {40.550486, -88.060516},
  {40.561286, -88.061514}, {39.065123, -88.674501}, {41.389193, -87.772914}, {42.48088, -88.99612},
  {38.59651, -88.967736}, {39.352261, -89.644688}, {39.189 ... 189, -89.5971},
  {39.864834, -89.594745}, {39.422809, -87.661666}, {38.548123, -89.773096}, {38.7849, -89.702307},
  {38.095086, -88.913791}, {38.549088, -89.763343}, {38.788362, -89.688869},
{38.030752, -88.923769}, {41.21407, -90.330727}}] -> "Status" -> {...}, Entity["AdministrativeDivision", {"Illinois", "UnitedStates"}]]data["Annotations"]Legended[PointValuePlot[data], PointLegend[...]]Locations and information of rest area facilities in Illinois:
locations = GeoPosition[{{41.393745, -89.566491}, {41.393737, -89.559088}, {40.550486, -88.060516},
  {40.561286, -88.061514}, {39.065123, -88.674501}, {41.389193, -87.772914}, {42.48088, -88.99612},
  {38.59651, -88.967736}, {39.352261, -89.644688}, {39.189 ... 189, -89.5971},
  {39.864834, -89.594745}, {39.422809, -87.661666}, {38.548123, -89.773096}, {38.7849, -89.702307},
  {38.095086, -88.913791}, {38.549088, -89.763343}, {38.788362, -89.688869},
{38.030752, -88.923769}, {41.21407, -90.330727}}];status = {...};
vending = {...};
accessibility = {...};
names = {...};areas = SpatialPointData[locations -> <|"Status" -> status, "Vending" -> vending, "Accessibility" -> accessibility, "Name" -> names|>]Available information for each rest area location:
areas[{"Annotations", "Keys"}]Visualize the accessible locations with mouseover names:
loc = MapThread[...];
legend = PointLegend[...];
Legended[GeoGraphics[{PointSize[.025], loc}, GeoProjection -> "Mercator", GeoRange -> Quantity[200, "Miles"]], legend]
Analyze the spatial distribution of earthquakes:
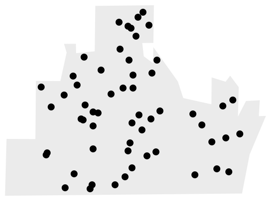
state = Entity["AdministrativeDivision", {"Oklahoma", "UnitedStates"}];data = EarthquakeData[state["Polygon"], 4, {{2010, 1, 1}, Today}, "Position"]Create the spatial point data from the values:
spd = SpatialPointData[GeoPosition[data["Values"]], state["Polygon"]]Visualize the locations of the earthquakes:
GeoGraphics[{Polygon[state], Point[spd]}]Properties & Relations (2)
Query properties of well-defined SpatialPointData:
data = {{41.69, 28.88}, {133.61, 36.75}, {693.6, 38.08}, {172.3, 52.17}, {509.57, 60.5}, {211.47, 82.14}, {299.61, 86.61}, {567.28, 87.6}, {729.98, 92.94}, {42.01, 95.63}};
dmarks = {"on", "off", "on", "on", "off", "off", "on", "on", "off", "off"};cmarks = {275.9, 241.2, 256., 442.9, 209.4, 260.4, 348.8, 315.2, 275.3, 317.8};spd = SpatialPointData[data -> {"Cell Type" -> dmarks, "Area" -> cmarks}]spd["Properties"]spd /@ {"ObservationRegion", "PointCount"}spd["Association"]Find the number of points in a subregion:
reg = Rectangle[{-4, -4}, {4, 4}];sample = RandomPointConfiguration[PoissonPointProcess[10, 2], reg]ListPlot[sample, AspectRatio -> 1]Number of points in some subregions:
reg1 = Disk[{0, 2}, 2];
sample["PointCount", reg1]reg2 = Rectangle[{-4, -3}, {1, -1}];
sample["PointCount", reg2]Show[RegionPlot[{reg1, reg2}, PlotRange -> {{-4, 4}, {-4, 4}}], ListPlot[sample], Axes -> True]Text
Wolfram Research (2020), SpatialPointData, Wolfram Language function, https://reference.wolfram.com/language/ref/SpatialPointData.html.
CMS
Wolfram Language. 2020. "SpatialPointData." Wolfram Language & System Documentation Center. Wolfram Research. https://reference.wolfram.com/language/ref/SpatialPointData.html.
APA
Wolfram Language. (2020). SpatialPointData. Wolfram Language & System Documentation Center. Retrieved from https://reference.wolfram.com/language/ref/SpatialPointData.html