Charting and Information Visualization
 Topic Overview
 The Wolfram Language's symbolic architecture and dynamic interface make possible a uniquely flexible and convenient approach to charting and information visualization. With sophisticated automation made possible by its computational aesthetics methodology, the Wolfram Language lets you immediately take data and produce compelling dynamic visualizations in a wide variety of formats—both predefined and arbitrarily extensible.
 BarChart — display data as bars
 PieChart — display data as part of the whole
 BubbleChart — display data as sized bubbles
 RectangleChart — display data as rectangles of variable sizes
 SectorChart — display data with variable sector sizes and radii
 PairedBarChart — display data as bars on opposite sides of the axis
 BarChart3D — display data as bars in 3D
 PieChart3D — display data as part of the whole in 3D
 BubbleChart3D — display data as sized bubbles in 3D
 RectangleChart3D — display data as cuboids of variable sizes
 SectorChart3D — display data with variable sector sizes, radii and height
Statistical Visualization »
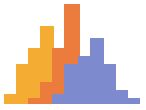 Histogram ▪
 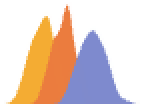 SmoothHistogram ▪
 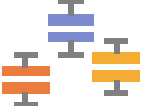 BoxWhiskerChart ▪
  QuantilePlot ▪ ...
Financial Visualization »
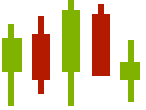 CandlestickChart ▪
  InteractiveTradingChart ▪
  RenkoChart ▪ ...
Data Visualization »
 ListPlot ▪
  ListLinePlot ▪
  DateListPlot ▪
  ArrayPlot ▪
  ListContourPlot ▪ ...
Geographic Visualization »
 GeoListPlot ▪
  GeoRegionValuePlot ▪
  GeoSmoothHistogram ▪
  GeoBubbleChart ▪ ...
Gauges »
 AngularGauge ▪
  HorizontalGauge ▪
  VerticalGauge ▪ ...
Dynamic & Combination Charting »
Manipulate ▪ Animate ▪ TabView ▪ Grid ▪ ...
Chart Labeling & Legending »
Labeled, ChartLabels — label individual elements, categories
Legended, ChartLegends — legend individual elements, categories
Placed ▪ LabelingFunction ▪ LegendAppearance ▪ ...
Chart Styling & Layout Options »
Style, ChartStyle — add styling to individual elements, categories
ChartStyle — overall layout for a chart (stacked vs. grouped etc.)
BarOrigin ▪ SectorOrigin ▪ BarSpacing ▪ SectorSpacing ▪ ...
Pictorial Charting & Special Effects »
Chart — palette of built-in chart element appearances
ChartElements ▪ ChartElementFunction ▪ ...
Annotation & Drilldown »
Tooltip ▪ StatusArea ▪ PopupWindow ▪ Button ▪ Hyperlink ▪ ...
Iconic Graphics
IconData — create various forms of standard parametrized icons