AstroGraphics[primitives,options]
宇宙と天球の二次元ビューを表す.
AstroGraphics
AstroGraphics[primitives,options]
宇宙と天球の二次元ビューを表す.
詳細とオプション
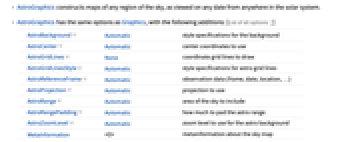
- AstroGraphicsは,任意の日付に太陽系の任意の場所から観測した天空の任意の領域の図を構築する.
- AstroGraphicsにはGraphicsと同じオプションに以下を加えたものが使える. [全オプションのリスト]
-
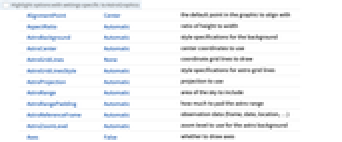
AstroBackground Automatic 背景のスタイル指定 AstroCenter Automatic 使用する中心座標 AstroGridLines None 描画する座標の格子線 AstroGridLinesStyle Automatic 天文格子線のスタイル指定 AstroReferenceFrame Automatic 観測データ(座標系,日付,場所等) AstroProjection Automatic 使用する投影法 AstroRange Automatic 含める空の部分 AstroRangePadding Automatic 天文領域をどの程度充填するか AstroZoomLevel Automatic 天文背景に使うズームレベル MetaInformation <||> 星図についてのメタ情報 PerformanceGoal Automatic パフォーマンスのどの面について最適化するか - AstroGraphics[]は,ユーザの現在の地理位置の地平線上の空の図を与える.
- AbsoluteOptionsを使って天文グラフィックスの明示的な値が与えられる.
- AstroGraphicsの使用にはインターネット接続が必要である.
- AstroGraphicsは太陽系オブジェクトの天体暦のデータファイルをダウンロードし,それをFileNameJoin[{$UserAddOnsDirectory,"ApplicationData","Astro"}]に永久的に保存する.
全オプションのリスト
例題
すべて開く すべて閉じる例 (5)
観測者の上空の現在の星図を,赤道面,黄道面,銀河面,地平面を示して表示する:
AstroGraphics[]指定された日付における観測者の上空の星図を背景画像を加えて表示する:
AstroGraphics[AstroReferenceFrame -> {"Horizon", DateObject[{2022, 10, 23, 15, 0, 0}]}, AstroBackground -> "GalacticSky"]AstroGraphics[Entity["Star", "Betelgeuse"], AstroRange -> Quantity[20, "AngularDegrees"], AstroReferenceFrame -> "Equatorial"]AstroGraphics[Entity["Star", "Betelgeuse"], AstroRange -> Quantity[30, "AngularDegrees"], AstroReferenceFrame -> "Equatorial", AstroBackground -> AstroStyling[{"BlackSky", "ShowConstellationIllustrations" -> True, "ShowMainPlanes" -> False}]]AstroGraphics[Entity["Star", "Shaula"], AstroRange -> Quantity[20, "AngularDegrees"], AstroBackground -> "GalacticSky", AstroReferenceFrame -> "Ecliptic"]2022年1月から2023年7月までの火星の位置を週単位で計算する:
mars = AstroPosition[Entity["Planet", "Mars"], {"Equatorial", #}]& /@ DateRange["1 Jul 2022", "1 July 2023", "Week"];AstroGraphics[{White, Point[mars]}, AstroReferenceFrame -> "Equatorial"]オプション (16)
AstroBackground (3)
AstroGraphicsは,デフォルトで,"BlackSky"スタイルを使用する:
AstroGraphics[AstroBackground -> "BlackSky"]白い背景で星の色が暗色の"WhiteSky"スタイルを使う:
AstroGraphics[AstroBackground -> "WhiteSky"]style = {
"ShowConstellationIllustrations" -> True,
"ShowConstellationRegions" -> True, "ConstellationRegionStyle" -> Darker[Blue, .2], "ConstellationLineStyle" -> Opacity[0.6, LightBlue],
"ShowConstellationBoundaries" -> True, "ConstellationBoundaryStyle" -> Directive[Dashing[{0, Tiny}], Yellow], "ConstellationNameStyle" -> GrayLevel[0.7]
};AstroGraphics[Entity["Constellation", "Scorpius"], AstroBackground -> AstroStyling[{"GalacticSky", "ShowConstellations" -> {Entity["Constellation", "Scorpius"]}, style, "HideObjects" -> Automatic}], AstroReferenceFrame -> "J2000"]AstroCenter (1)
AstroGridLines (2)
AstroGraphics[AstroGridLines -> Automatic]星図の構築に使ったフレーム以外のフレームの天文格子線を加える:
AstroGraphics[AstroGridLines -> {"Galactic" -> Quantity[15, "AngularDegrees"]}]AstroGraphics[AstroGridLines -> {"Equatorial" -> Quantity[{45, 10}, "AngularDegrees"]}]AstroGridLinesStyle (1)
AstroProjection (1)
AstroGraphics[AstroProjection -> "LambertAzimuthal", AstroRangePadding -> None, AstroReferenceFrame -> {"Equatorial", Now, Here}, AstroRange -> {All, All}]AstroGraphics[AstroProjection -> "WinkelTripel", AstroRangePadding -> None, AstroRange -> {All, All}]AstroRange (1)
AstroRangePadding (1)
AstroReferenceFrame (5)
デフォルトで,AstroGraphicsはローカルな水平座標系と"Stereographic"図法を使用する:
AstroGraphics[]赤道座標系を使って空全体を"Equirectangular"図法で表示する:
AstroGraphics[AstroReferenceFrame -> {"Equatorial", Now, Here}]黄道座標系を使って空全体を"Equirectangular"図法で表示する:
AstroGraphics[AstroReferenceFrame -> {"Ecliptic", Now, Here}]銀河座標系を使って空全体を"Mollweide"図法を使った結果で表示する:
AstroGraphics[AstroReferenceFrame -> {"Galactic", Now, Here}]過去14000年間の天の北極の位置を1000年ごとに計算する:
NCPs = Table[AstroPosition[{0, 90}, {"Equatorial", DateObject[{y, 1, 1, 0, 0, 0}]}], {y, 2022, -12000, -1000}];AstroGraphics[{Red, Point@NCPs}, AstroReferenceFrame -> {"Ecliptic", "Epoch" -> Now}, AstroGridLines -> Automatic]AstroZoomLevel (1)
異なるズームレベルを使って異なるレベルの背景画像品質を得る:
Table[AstroGraphics[Entity["Nebula", "M8"], AstroReferenceFrame -> "J2000", AstroBackground -> AstroStyling[{"GalacticSky", "HideObjects" -> Automatic}], AstroRange -> Quantity[15, "AngularDegrees"], AstroZoomLevel -> zoom, ImageSize -> 250], {zoom, 1, 4}]アプリケーション (6)
太陽の位置によって形成されるアナレンマを1年間に渡って毎日定時に構築する:
loc = Entity["City", {"NewYork", "NewYork", "UnitedStates"}];
hour = 12;suns = Table[AstroPosition[Entity["Star", "Sun"], {"Horizon", DateObject[{2022, 1, d, hour}], loc}], {d, 1, 365}];AstroGraphics[{White, Point[Take[suns, {1, -1, 7}]]}, AstroReferenceFrame -> {"Horizon", DateObject[{2022, 3, 19, hour}], loc}, AstroProjection -> {"Stereographic", "Centering" -> {0, 180}}, AstroRange -> {{115, 245}, {-5, 80}}]AstroGraphics[{White, Point[Take[suns, {1, -1, 7}]]}, AstroReferenceFrame -> {"Horizon", DateObject[{2022, 6, 18, hour}], loc}, AstroProjection -> {"Stereographic", "Centering" -> {0, 180}}, AstroRange -> {{115, 245}, {-5, 80}}]loc = GeoPosition[{40, -90}];
hour = 12;
tz = -5;venus = Table[AstroPosition[Entity["Planet", "Venus"], {"Horizon", DateObject[{2000, 1, d, 12}, TimeZone -> tz], loc}], {d, 1, 8 365}];AstroGraphics[{White, PointSize[Tiny], Point[venus]}, AstroReferenceFrame -> {"Horizon", DateObject[{2004, 7, 1, hour}, TimeZone -> tz], loc}, AstroProjection -> {"Stereographic", "Centering" -> {0, 180}}, AstroRange -> {{90, 240}, {-5, 80}}]AstroGraphics[AstroRange -> {{85, 275}, {-1, 55}}, AstroReferenceFrame -> {"Horizon", DateObject[{2022, 10, 24, 14, 0, 0}], Here}, AstroProjection -> {"Stereographic", "Centering" -> {0, 180}}, AstroGridLines -> Quantity[15, "AngularDegrees"], AstroGridLinesStyle -> Opacity[.2, White]]2065年11月22日に南極付近でよく見える,木星の前を金星が通過する様子を観察する:
Manipulate[AstroGraphics[Entity["Planet", "Jupiter"], AstroReferenceFrame -> {"Equatorial", DateObject[{2065, 11, 22, h, 0, 0}, TimeZone -> 0], GeoPosition[{-90, 0}]}, AstroRange -> Quantity[0.02, "AngularDegrees"]], {h, 12.5, 13}, SynchronousUpdating -> False]
| |
Manipulate[AstroGraphics[Entity["Star", "Sun"], AstroReferenceFrame -> {"Equatorial", date, Entity["City", {"Eugene", "Oregon", "UnitedStates"}]}, AstroRange -> Quantity[1, "AngularDegrees"], PlotLabel -> date], {{date, DateObject[{2023, 10, 14, 9, 20, 0}, "Instant", "Gregorian", "America/Los_Angeles"]}, DateObject[{2023, 10, 14, 8, 0, 0}, "Instant", "Gregorian", "America/Los_Angeles"], DateObject[{2023, 10, 14, 11, 0, 0}, "Instant", "Gregorian", "America/Los_Angeles"], Quantity[1, "Minutes"]}, SynchronousUpdating -> False]エディントン(Eddington)が光の偏向に関するアインシュタイン(Einstein)の予測の確認に使った有名な日食を可視化する:
Manipulate[
AstroGraphics[Entity["Star", "Sun"], AstroReferenceFrame -> {"Equatorial", DateObject[{1919, 5, 29, h}, "Instant"], Entity["Island", "PrincipeIsland"]}, AstroRange -> Quantity[1, "AngularDegrees"]], {h, 7, 12}, SynchronousUpdating -> False]考えられる問題 (1)
date = DateObject[{2024, 7, 12, 3, 30, 0}, TimeZone -> "America/Chicago"];mars = AstroPosition[Entity["Planet", "Mars"], {"Horizon", date}]デフォルトで,AstroGraphicsの背景は計算された火星の座標に対応する空の現在の領域を示すが,これは観測された日付に火星があった領域ではない:
AstroGraphics[{Red, Point[mars]}]観測した日付を指定して,観測時点で火星が存在した空の正しい領域を表示する.火星の自動背景ラベルが表示されるようになった:
AstroGraphics[{Red, Point[mars]}, AstroReferenceFrame -> {"Horizon", date}]関連するガイド
-
▪
- 天文学の計算とデータ ▪
- 天文学の可視化
テキスト
Wolfram Research (2022), AstroGraphics, Wolfram言語関数, https://reference.wolfram.com/language/ref/AstroGraphics.html (2024年に更新).
CMS
Wolfram Language. 2022. "AstroGraphics." Wolfram Language & System Documentation Center. Wolfram Research. Last Modified 2024. https://reference.wolfram.com/language/ref/AstroGraphics.html.
APA
Wolfram Language. (2022). AstroGraphics. Wolfram Language & System Documentation Center. Retrieved from https://reference.wolfram.com/language/ref/AstroGraphics.html
BibTeX
@misc{reference.wolfram_2026_astrographics, author="Wolfram Research", title="{AstroGraphics}", year="2024", howpublished="\url{https://reference.wolfram.com/language/ref/AstroGraphics.html}", note=[Accessed: 17-August-2026]}
BibLaTeX
@online{reference.wolfram_2026_astrographics, organization={Wolfram Research}, title={AstroGraphics}, year={2024}, url={https://reference.wolfram.com/language/ref/AstroGraphics.html}, note=[Accessed: 17-August-2026]}