

CentralFeature[{x1,x2,…}]
要素
の中心特徴を与える.
CentralFeature[{x1v1,x2v2,…}]
中心特徴
に対応する viを与える.
CentralFeature[data]
data のいくつかの異なる形についての中心特徴を与える.
CentralFeature
CentralFeature[{x1,x2,…}]
要素
の中心特徴を与える.
CentralFeature[{x1v1,x2v2,…}]
中心特徴
に対応する viを与える.
CentralFeature[data]
data のいくつかの異なる形についての中心特徴を与える.
詳細とオプション
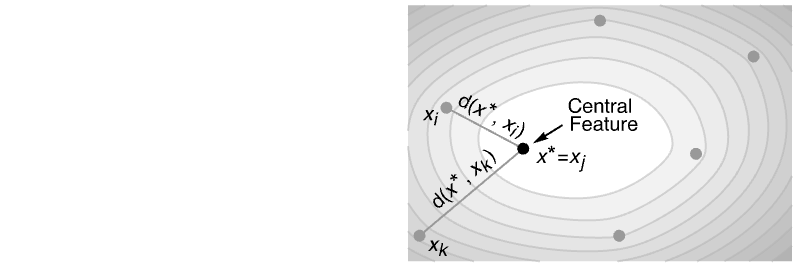
- CentralFeatureは位置測度であり,データ中で他のすべての点までの距離の和が最小である点を与える.
- CentralFeatureは,重みがない場合は距離の和

が,重みがある場合は
が最小になる要素
を求める. - データ data には次の形と解釈がある.
-
{data1,data2,…} 数値,地理空間,テキスト,視覚,日付と時間を含むさまざまなフォーマットのデータおよびその組合せのリスト {data1,data2,…}{v1,v2,…} 指標{v1,v2,…}を含むデータ {data1,data2,…}Automatic viを連続する整数 i であるとみなす GeoPosition[…] 測地位置の配列 WeightedData[…] 重み付きデータ - 次は使用可能なオプションである.
-
DistanceFunction Automatic 使用する距離測度 - DistanceFunctionの設定は,任意の距離関数,非類似度関数または2点間の距離を定義する関数 f でよい.
- デフォルトで,異なるタイプの要素について次の距離関数が使われる.
-
EuclideanDistance 数値データ ImageDistance 画像 JaccardDissimilarity ブールデータ EditDistance テキストと名義的列 Abs[DateDifference[#1,#2]]& 日付と時間 ColorDistance 色 GeoDistance 地理空間データ Boole[SameQ[#1,#2]]& 名義データ HammingDistance 名義ベクトルデータ WarpingDistance 数列 - オプションDistanceFunctionがAutomaticのときは,まずConformImagesを使ってすべての画像が一致するようにされる.
- デフォルトで,データ要素が混合タイプのベクトルのときは,距離は各タイプについて別々に計算され,Normを使って組み合される.
例題
すべて開く すべて閉じる例 (2)
スコープ (9)
data = {{1, 2}, {3, 4}, {8, 7}, {6, 5}, {9, 4}, {1, 3}};CentralFeature[data]CentralFeature[data -> Automatic]CentralFeature[data -> Table[f[i], {i, 6}]]CentralFeature[{{1, 2} -> g[1], {3, 4} -> g[2], {8, 7} -> g[3], {6, 5} -> g[4], {9, 4} -> g[5], {1, 3} -> g[6]}]中心特徴はWeightedDataに使うことができる:
wd = WeightedData[{{1., 3.}, {-4., 2.}, {3., 1.}, {5., 6.}}, {1., 3., 4., 5.}];CentralFeature[wd]CentralFeature[wd -> {1, 2, 3, 4}]CentralFeature[RandomReal[1, {10 ^ 5, 2}]]CentralFeature[WeightedData[RandomReal[1, {10 ^ 5, 3}], RandomReal[1, 10 ^ 5]]]data = Quantity[RandomReal[1, {6, 2}], "Meters"]CentralFeature[data]CentralFeature[{[image], [image], [image], [image], [image], [image], [image], [image], [image], [image]}]CentralFeature[{[image], [image], [image], [image], [image], [image]}]CentralFeature[{[image], [image], [image], [image], [image]}]"String"型のTabularColumnオブジェクトの中心的な特徴を計算する:
col = TabularColumn[{"abcd", "bcde", "abab", "abcdef", "agi"}]CentralFeature[col]CentralFeature[{{True, False, True}, {True, True, True}, {True, False, False}, {False, False, False}}]CentralFeature[{DateObject[{1985, 10, 3}], DateObject[{1989, 5, 30}], DateObject[{1999, 11, 15}], DateObject[]}]cities = {Entity["City", {"Paris", "IleDeFrance", "France"}], Entity["City", {"Sydney", "NewSouthWales", "Australia"}], Entity["City", {"Boston", "Massachusetts", "UnitedStates"}], Entity["City", {"SanFrancisco", "California", "UnitedStates"}], Entity["City", {"Tokyo", "Tokyo", "Japan"}]};cf = CentralFeature[GeoPosition[cities]]GeoGraphics[{GeoPath[Thread[{cf, cities}]], GeoMarker[cities, Gray], GeoMarker[cf, Red]}, GeoProjection -> {"AzimuthalEquidistant", "Centering" -> cf}, GeoRange -> "World", GeoGridLines -> Automatic]オプション (2)
DistanceFunction (2)
CentralFeature[RandomVariate[NormalDistribution[], {10, 3}]]ChessboardDistanceは離れている距離が最大の次元のみを考慮する:
CentralFeature[{{1., 3.}, {-2.6, 4.}, {9.2, 5.}, {7.3, -5.}}, DistanceFunction -> ChessboardDistance]DistanceFunctionは記号で与えることができる:
dist[{u_, v_}, {x_, y_}] := Sqrt[3(u - x) ^ 2 + 2(v - y) ^ 2]data = {{1.5, .6}, {2, 0}, {1.25, 1.25}, {3., 0.3}};CentralFeature[data, DistanceFunction -> dist]CentralFeature[data, DistanceFunction -> (Sqrt[{3, 2}.(#1 - #2) ^ 2]&)]アプリケーション (4)
data = {{3., -5.}, {2., -5.}, {0., 2.}, {-4., -3.}, {10 ^ 8, -1.}, {8., -20000}};CentralFeature[data]極値はMeanに大きく影響する:
Mean[data]poly = Polygon[{{2., -5.}, {0., 2.}, {-4., -3.}, {-5, -7}}];
pts = RandomPoint[poly, 10 ^ 3];Graphics[{Lighter[Blue, .9], poly, Black, PointSize[Small], Point[pts]}]ランダムな点の中心特徴を計算することで,多角形の中心を推定する:
cf = CentralFeature[pts]Graphics[{Lighter[Blue, .9], poly, Black, PointSize[Small], Point[pts], PointSize[0.06], Red, Point[cf]}]cities = CityData[{All, "California"}];
locations = GeoPosition[CityData[#, "Coordinates"]& /@ cities];unweighted = cities[[CentralFeature[locations -> Automatic]]]人口で重みを付けた都市の位置に基づいてカリフォルニア州の中心特徴を求める:
populations = CityData[#, "Population"]& /@ cities;weighted = cities[[CentralFeature[WeightedData[locations, populations] -> Automatic]]]都市の位置(灰色),重みなしの中心特徴(赤),重みありの中心特徴(黒)を描画する:
legend = PointLegend[{Red, Blue}, {"unweighted central feature", "central feature weighted by population"}, LegendMarkerSize -> Large];Legended[GeoGraphics[{EdgeForm[Black], FaceForm[Orange], Polygon[Entity["AdministrativeDivision", {"California", "UnitedStates"}]], GrayLevel[.4], PointSize[0.0075], Point[locations], PointSize[0.04], Red, Point[unweighted], Blue, Point[weighted]}, GeoRange -> {{32, 43}, {-125, -114}}, ImageSize -> 350], Placed[legend, "Bottom"]]cities = CityData[{Large, "Ohio"}]TravelDistanceに基づいたこれら8都市の中心特徴:
center = CentralFeature[cities, DistanceFunction -> TravelDistance]TravelDistanceに基づいた,中心特徴から他の都市までの距離の和:
Total[Table[TravelDistance[center, city], {city, cities}]]GeoGraphics[{EdgeForm[Black], FaceForm[Orange], Polygon[Entity["AdministrativeDivision", {"Ohio", "UnitedStates"}]], Red, TravelDirections[{center, #}, "TravelPath"]& /@ cities, GrayLevel[.4], PointSize[0.03], Point /@ cities, PointSize[0.03], Red, Point[center]}]特性と関係 (5)
CentralFeatureは多変量の位置測度である:
pts = {{3, -5}, {2, -5}, {0, 2}, {-4, -3}, {-3, 2}, {-5, -5}, {-1, -5}, {-1, -5}, {5, -1}, {-3, 3}, {10, -1}, {8, -2}};Graphics[{PointSize[0.03], Orange, Point[pts]}]cf = CentralFeature[pts]Meanもまた位置測度である:
mean = Mean[pts]Graphics[{PointSize[0.03], Orange, Point[pts], Locator[cf], Blue, PointSize[.04], Point[mean], Gray, Text["Central Feature", cf - {0, .8}], Text["Mean", mean + {0, .8}]}, ImageSize -> 250]CentralFeatureは距離の和を最小にするデータに属する点を求める:
data = {{1., 3.}, {4., 6.}, {9., 2.}, {5., 5.}, {7., -2.}};cf = CentralFeature[data]sumofdists[x_, y_] := Total[Sqrt[Total[(Transpose[data] - {x, y}) ^ 2]]]{ind} = Ordering[sumofdists@@@data, 1];
data[[ind]]sumofdists = Total[Sqrt[Total[(Transpose[data] - {#1, #2}) ^ 2]]]&;
ContourPlot[sumofdists[x, y], {x, 0, 10}, {y, -3, 8}, Contours -> 10, PlotLegends -> Automatic, Epilog -> {PointSize[Large], Black, Point[data], Red, PointSize[Large], Point[cf], White, Text["Central Feature", cf - {0, 0.7}]}]CentralFeatureは,データの長さが奇数のときは,一変量データのMedianに等しい:
data = RandomReal[1, 1001];CentralFeature[data] == Median[data]CentralFeatureは,他のデータ点までの距離の和を最小にするデータ中の要素を求める:
data = RandomVariate[NormalDistribution[], {10, 3}];MemberQ[data, CentralFeature[data]]SpatialMedianは,距離の和を最小にする領域内の点を求める:
MemberQ[data, SpatialMedian[data]]CentralFeatureについての距離の和はSpatialMedianについてのそれ以上である:
sumofdists = Total[Sqrt[Total[(Transpose[data] - #) ^ 2]]]&;sumofdists[CentralFeature[data]] ≥ sumofdists[SpatialMedian[data]]辺の重みが0から1までで一様にサンプルされたランダムグラフを作る:
SeedRandom[7];
graph = RandomGraph[{10, 15}, EdgeWeight -> RandomReal[1, 15]]GraphCenterを求める:
GraphCenter[graph]GraphDistanceを使って各頂点ペア間の距離を求める:
distfun = GraphDistance[graph, #1, #2]&;CentralFeatureを使って中心を求める:
CentralFeature[Range[10], DistanceFunction -> distfun]考えられる問題 (1)
CentralFeatureは,重みがない2要素のリストについては最初のリストを返す:
data = {GeoPosition[{20, -30}], GeoPosition[{15, 15}]};CentralFeature[data]重みがある2要素のリストについては,重みが最高のものが選択されるが,これは
を自明に最小化する:
CentralFeature[WeightedData[data, {1, 2}]]テキスト
Wolfram Research (2017), CentralFeature, Wolfram言語関数, https://reference.wolfram.com/language/ref/CentralFeature.html.
CMS
Wolfram Language. 2017. "CentralFeature." Wolfram Language & System Documentation Center. Wolfram Research. https://reference.wolfram.com/language/ref/CentralFeature.html.
APA
Wolfram Language. (2017). CentralFeature. Wolfram Language & System Documentation Center. Retrieved from https://reference.wolfram.com/language/ref/CentralFeature.html
BibTeX
@misc{reference.wolfram_2026_centralfeature, author="Wolfram Research", title="{CentralFeature}", year="2017", howpublished="\url{https://reference.wolfram.com/language/ref/CentralFeature.html}", note=[Accessed: 18-August-2026]}
BibLaTeX
@online{reference.wolfram_2026_centralfeature, organization={Wolfram Research}, title={CentralFeature}, year={2017}, url={https://reference.wolfram.com/language/ref/CentralFeature.html}, note=[Accessed: 18-August-2026]}

