CentralFeature[{x1,x2,…}]
给出元素
的中心要素.
CentralFeature[{x1v1,x2v2,…}]
给出对应于中心要素
的 vi.
CentralFeature[data]
给出不同格式的 data 的中心要素.
CentralFeature
CentralFeature[{x1,x2,…}]
给出元素
的中心要素.
CentralFeature[{x1v1,x2v2,…}]
给出对应于中心要素
的 vi.
CentralFeature[data]
给出不同格式的 data 的中心要素.
更多信息和选项
- CentralFeature 是一种位置度量. 它给出数据中距其他点的的距离的总和最小的那个点.
- CentralFeature 找出使得距离和

(没有加权) 最小的元素
,有加权的情况下,为
. - 数据 data 的格式和解释如下所示:
-
{data1,data2,…} 不同格式的数据的列表,包括数值、地理空间、文字、可视图形、日期、时间,以及上述类型的组合 {data1,data2,…}{v1,v2,…} 带有索引 {v1,v2,…} 的数据 {data1,data2,…}Automatic vi 取连续整数 i GeoPosition[…] 测地位置数组 WeightedData[…] 带有权重的数据 - 可以给出下列选项:
-
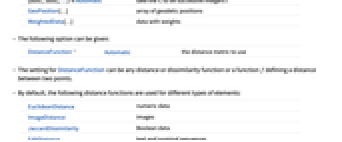
DistanceFunction Automatic 要使用的距离度量 - DistanceFunction 的设置可以为任意距离、相异度函数或定义两点之间的距离的函数 f.
- 缺省情况下,下列距离函数被用于不同类型的元素:
-
EuclideanDistance 数值型数据 ImageDistance 图像 JaccardDissimilarity 布尔数据 EditDistance 文字和标称序列 Abs[DateDifference[#1,#2]]& 日期和时间 ColorDistance 颜色 GeoDistance 地理空间数据 Boole[SameQ[#1,#2]]& 标称数据 HammingDistance 标称向量数据 WarpingDistance 数值序列 - 当选项 DistanceFunction 设为 Automatic 时,先用 ConformImages 对所有图像进行一致化 (conform) 处理.
- 缺省情况下,如果数据元素是混合类型的向量,对每个类型单独计算距离,再用 Norm 组合在一起.
范例
打开所有单元 关闭所有单元基本范例 (2)
范围 (9)
data = {{1, 2}, {3, 4}, {8, 7}, {6, 5}, {9, 4}, {1, 3}};CentralFeature[data]CentralFeature[data -> Automatic]CentralFeature[data -> Table[f[i], {i, 6}]]CentralFeature[{{1, 2} -> g[1], {3, 4} -> g[2], {8, 7} -> g[3], {6, 5} -> g[4], {9, 4} -> g[5], {1, 3} -> g[6]}]可对 WeightedData 求中心要素:
wd = WeightedData[{{1., 3.}, {-4., 2.}, {3., 1.}, {5., 6.}}, {1., 3., 4., 5.}];CentralFeature[wd]CentralFeature[wd -> {1, 2, 3, 4}]CentralFeature[RandomReal[1, {10 ^ 5, 2}]]CentralFeature[WeightedData[RandomReal[1, {10 ^ 5, 3}], RandomReal[1, 10 ^ 5]]]data = Quantity[RandomReal[1, {6, 2}], "Meters"]CentralFeature[data]CentralFeature[{[image], [image], [image], [image], [image], [image], [image], [image], [image], [image]}]CentralFeature[{[image], [image], [image], [image], [image], [image]}]CentralFeature[{[image], [image], [image], [image], [image]}]计算类型为 "String" 的 TabularColumn 对象的中心要素:
col = TabularColumn[{"abcd", "bcde", "abab", "abcdef", "agi"}]CentralFeature[col]CentralFeature[{{True, False, True}, {True, True, True}, {True, False, False}, {False, False, False}}]CentralFeature[{DateObject[{1985, 10, 3}], DateObject[{1989, 5, 30}], DateObject[{1999, 11, 15}], DateObject[]}]cities = {Entity["City", {"Paris", "IleDeFrance", "France"}], Entity["City", {"Sydney", "NewSouthWales", "Australia"}], Entity["City", {"Boston", "Massachusetts", "UnitedStates"}], Entity["City", {"SanFrancisco", "California", "UnitedStates"}], Entity["City", {"Tokyo", "Tokyo", "Japan"}]};cf = CentralFeature[GeoPosition[cities]]GeoGraphics[{GeoPath[Thread[{cf, cities}]], GeoMarker[cities, Gray], GeoMarker[cf, Red]}, GeoProjection -> {"AzimuthalEquidistant", "Centering" -> cf}, GeoRange -> "World", GeoGridLines -> Automatic]选项 (2)
DistanceFunction (2)
CentralFeature[RandomVariate[NormalDistribution[], {10, 3}]]ChessboardDistance 只考虑考虑具有最大间隔的维度:
CentralFeature[{{1., 3.}, {-2.6, 4.}, {9.2, 5.}, {7.3, -5.}}, DistanceFunction -> ChessboardDistance]可用符号给出 DistanceFunction:
dist[{u_, v_}, {x_, y_}] := Sqrt[3(u - x) ^ 2 + 2(v - y) ^ 2]data = {{1.5, .6}, {2, 0}, {1.25, 1.25}, {3., 0.3}};CentralFeature[data, DistanceFunction -> dist]CentralFeature[data, DistanceFunction -> (Sqrt[{3, 2}.(#1 - #2) ^ 2]&)]应用 (4)
data = {{3., -5.}, {2., -5.}, {0., 2.}, {-4., -3.}, {10 ^ 8, -1.}, {8., -20000}};CentralFeature[data]极值对 Mean 有很大的影响:
Mean[data]poly = Polygon[{{2., -5.}, {0., 2.}, {-4., -3.}, {-5, -7}}];
pts = RandomPoint[poly, 10 ^ 3];Graphics[{Lighter[Blue, .9], poly, Black, PointSize[Small], Point[pts]}]cf = CentralFeature[pts]Graphics[{Lighter[Blue, .9], poly, Black, PointSize[Small], Point[pts], PointSize[0.06], Red, Point[cf]}]cities = CityData[{All, "California"}];
locations = GeoPosition[CityData[#, "Coordinates"]& /@ cities];unweighted = cities[[CentralFeature[locations -> Automatic]]]populations = CityData[#, "Population"]& /@ cities;weighted = cities[[CentralFeature[WeightedData[locations, populations] -> Automatic]]]画出城市的位置(灰色),未加权的中心要素(红色)和加权的中心要素(黑色):
legend = PointLegend[{Red, Blue}, {"unweighted central feature", "central feature weighted by population"}, LegendMarkerSize -> Large];Legended[GeoGraphics[{EdgeForm[Black], FaceForm[Orange], Polygon[Entity["AdministrativeDivision", {"California", "UnitedStates"}]], GrayLevel[.4], PointSize[0.0075], Point[locations], PointSize[0.04], Red, Point[unweighted], Blue, Point[weighted]}, GeoRange -> {{32, 43}, {-125, -114}}, ImageSize -> 350], Placed[legend, "Bottom"]]cities = CityData[{Large, "Ohio"}]根据 TravelDistance 算出的八个城市的中心要素:
center = CentralFeature[cities, DistanceFunction -> TravelDistance]根据 TravelDistance 算出的从中心要素到其他城市的距离的和:
Total[Table[TravelDistance[center, city], {city, cities}]]GeoGraphics[{EdgeForm[Black], FaceForm[Orange], Polygon[Entity["AdministrativeDivision", {"Ohio", "UnitedStates"}]], Red, TravelDirections[{center, #}, "TravelPath"]& /@ cities, GrayLevel[.4], PointSize[0.03], Point /@ cities, PointSize[0.03], Red, Point[center]}]属性和关系 (5)
CentralFeature 是一个多变量位置度量:
pts = {{3, -5}, {2, -5}, {0, 2}, {-4, -3}, {-3, 2}, {-5, -5}, {-1, -5}, {-1, -5}, {5, -1}, {-3, 3}, {10, -1}, {8, -2}};Graphics[{PointSize[0.03], Orange, Point[pts]}]cf = CentralFeature[pts]Mean 也是一种位置度量:
mean = Mean[pts]Graphics[{PointSize[0.03], Orange, Point[pts], Locator[cf], Blue, PointSize[.04], Point[mean], Gray, Text["Central Feature", cf - {0, .8}], Text["Mean", mean + {0, .8}]}, ImageSize -> 250]CentralFeature 找出最小化距离和的数据点:
data = {{1., 3.}, {4., 6.}, {9., 2.}, {5., 5.}, {7., -2.}};cf = CentralFeature[data]sumofdists[x_, y_] := Total[Sqrt[Total[(Transpose[data] - {x, y}) ^ 2]]]{ind} = Ordering[sumofdists@@@data, 1];
data[[ind]]sumofdists = Total[Sqrt[Total[(Transpose[data] - {#1, #2}) ^ 2]]]&;
ContourPlot[sumofdists[x, y], {x, 0, 10}, {y, -3, 8}, Contours -> 10, PlotLegends -> Automatic, Epilog -> {PointSize[Large], Black, Point[data], Red, PointSize[Large], Point[cf], White, Text["Central Feature", cf - {0, 0.7}]}]对于单变量数据,当数据长度是奇数时, CentralFeature 与 Median 相同:
data = RandomReal[1, 1001];CentralFeature[data] == Median[data]CentralFeature 找出数据中使得到其他数据点的距离之和最小化的元素:
data = RandomVariate[NormalDistribution[], {10, 3}];MemberQ[data, CentralFeature[data]]SpatialMedian 找出域中最小化距离和的点:
MemberQ[data, SpatialMedian[data]]相对于 CentralFeature 的距离和要大于或等于相对于 SpatialMedian 的距离和:
sumofdists = Total[Sqrt[Total[(Transpose[data] - #) ^ 2]]]&;sumofdists[CentralFeature[data]] ≥ sumofdists[SpatialMedian[data]]SeedRandom[7];
graph = RandomGraph[{10, 15}, EdgeWeight -> RandomReal[1, 15]]找出 GraphCenter:
GraphCenter[graph]用 GraphDistance 指定每对顶点间的距离:
distfun = GraphDistance[graph, #1, #2]&;用 CentralFeature 找出中心:
CentralFeature[Range[10], DistanceFunction -> distfun]可能存在的问题 (1)
对于非加权的双元素列表,CentralFeature 返回第一个元素:

data = {GeoPosition[{20, -30}], GeoPosition[{15, 15}]};CentralFeature[data]CentralFeature[WeightedData[data, {1, 2}]]文本
Wolfram Research (2017),CentralFeature,Wolfram 语言函数,https://reference.wolfram.com/language/ref/CentralFeature.html.
CMS
Wolfram 语言. 2017. "CentralFeature." Wolfram 语言与系统参考资料中心. Wolfram Research. https://reference.wolfram.com/language/ref/CentralFeature.html.
APA
Wolfram 语言. (2017). CentralFeature. Wolfram 语言与系统参考资料中心. 追溯自 https://reference.wolfram.com/language/ref/CentralFeature.html 年
BibTeX
@misc{reference.wolfram_2026_centralfeature, author="Wolfram Research", title="{CentralFeature}", year="2017", howpublished="\url{https://reference.wolfram.com/language/ref/CentralFeature.html}", note=[Accessed: 19-August-2026]}
BibLaTeX
@online{reference.wolfram_2026_centralfeature, organization={Wolfram Research}, title={CentralFeature}, year={2017}, url={https://reference.wolfram.com/language/ref/CentralFeature.html}, note=[Accessed: 19-August-2026]}