ExampleData["type"]
给出指定类型范例名称列表.
ExampleData[{"type","name"}]
给出指定类型指定范例的默认形式.
ExampleData[{"type","name"},"elem"]
给出指定元素或范例的属性.
ExampleData
ExampleData["type"]
给出指定类型范例名称列表.
ExampleData[{"type","name"}]
给出指定类型指定范例的默认形式.
ExampleData[{"type","name"},"elem"]
给出指定元素或范例的属性.
更多信息
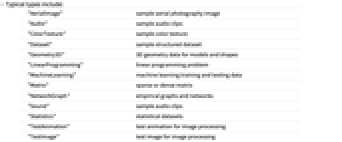
- 典型类型包括:
-
"AerialImage" 空中摄影图像样本 "Audio" 音频片段样本 "ColorTexture" 颜色纹理样本 "Dataset" 结构化数据集样本 "Geometry3D" 模型和形状的三维几何数据 "LinearProgramming" 线性规划问题 "MachineLearning" 机器学习训练和检验数据 "Matrix" 稀疏或稠密矩阵 "NetworkGraph" 经验图形和网络 "Sound" 声音片段样本 "Statistics" 统计数据集 "TestAnimation" 图像处理用的测试动画 "TestImage" 图像处理用的测试图像 "TestImage3D" 图像处理用的测试三维体 "TestImageSet" 测试图像集合 "Text" 文本段样本 "Texture" 纹理样本 - ExampleData[{"type","name"},"Properties"] 给出特定范例可用的元素或属性列表.
- 除了一种范例内容特定的元素,通常也包括以下属性:
-
"Image" 范例的基本视觉表现 "Name" 英语名称 - ExampleData[] 给出范例类型的名称组成的列表.
范例
打开所有单元 关闭所有单元基本范例 (5)
ExampleData[{"TestImage", "House"}]ExampleData[{"Geometry3D", "SpaceShuttle"}]StringTake[ExampleData[{"Text", "DeclarationOfIndependence"}], 400]ExampleData[]ExampleData["Texture"]范围 (32)
图形数据 (6)
ExampleData[{"AerialImage", "Pentagon"}]ExampleData[{"AerialImage", "Pentagon"}, "Properties"]ExampleData[{"AerialImage", "Pentagon"}, "ImageSize"]MatrixPlot[Abs[Fourier[ExampleData[{"AerialImage", "Pentagon"}, "Data"]]]]ExampleData[{"Texture", "Wood"}]ExampleData[{"ColorTexture", "GoldenOak"}]ExampleData[{"TestImage", "Mandrill"}]ExampleData[{"TestImage", "Couple2"}]动画数据 (1)
ExampleData[{"TestAnimation", "ToyVehicles"}]ExampleData[{"TestAnimation", "ToyVehicles"}, "Properties"]Take[ExampleData[{"TestAnimation", "ToyVehicles"}, "Frames"], 4]Show[ExampleData[#], ImageSize -> Tiny]& /@ %图像集合 (2)
三维几何 (2)
ExampleData[{"Geometry3D", "StanfordBunny"}]ExampleData[{"Geometry3D", "StanfordBunny"}, "Properties"]Length[%]bunny = ExampleData[{"Geometry3D", "StanfordBunny"}, "Region"]RegionBounds[bunny]Area[bunny]三维图像数据 (1)
数值数据 (5)
Length[ExampleData["Matrix"]]MatrixPlot[ExampleData[{"Matrix", "FIDAP007"}]]ExampleData[{"Matrix", "FIDAP007"}, "Properties"]ExampleData[{"LinearProgramming", "afiro"}]MatrixPlot[ExampleData[{"LinearProgramming", "bgetam"}, "ConstraintMatrix"]]统计数据 (6)
Take[ExampleData["Statistics"], 10]ExampleData[{"Statistics", "AnimalWeights"}, "Properties"]Take[ExampleData[{"Statistics", "AnimalWeights"}], 5]//MatrixFormTake[ExampleData[{"Statistics", "AnimalWeights"}, "DataElements"], 5]//MatrixForm列类型或者是 "Numeric" 或者是 "Categorical":
ExampleData[{"Statistics", "AnimalWeights"}, "ColumnTypes"]//TableFormExampleData[{"Statistics", "OldFaithful"}, "Description"]ExampleData[{"Statistics", "OldFaithful"}, "LongDescription"]//TraditionalFormExampleData[{"Statistics", "OldFaithful"}, "ColumnHeadings"]//ColumnExampleData[{"Statistics", "OldFaithful"}, "ColumnDescriptions"]//ColumnExampleData[{"Statistics", "OldFaithful"}, "Dimensions"]ExampleData[{"Statistics", "OldFaithful"}, "ObservationCount"]创建数据集的 SmoothHistogram:
SmoothHistogram[ExampleData[{"Statistics", "BuffaloSnow"}], PlotLabel -> ExampleData[{"Statistics", "BuffaloSnow"}, "Name"]]data = ExampleData[{"Statistics", "CPUPerformance"}];types = ExampleData[{"Statistics", "CPUPerformance"}, "ColumnTypes"]headings = ExampleData[{"Statistics", "CPUPerformance"}, "ColumnHeadings"]numeric = Pick[Transpose@data, types, "Numeric"];计算每个特征的 Mean 和 StandardDeviation:
mean = Mean /@ numeric//N;
sd = StandardDeviation /@ numeric//N;TableForm[{mean, sd}, TableHeadings -> {{"Mean", "StDev"}, Pick[headings, types, "Numeric"]}, TableSpacing -> {2, 1.2}, TableAlignments -> Center]文本 (5)
Take[ExampleData["Text"], 10]StringTake[ExampleData[{"Text", "OriginOfSpecies"}], 400]ExampleData[{"Text", "OriginOfSpecies"}, "Properties"]ExampleData[{"Text", "OriginOfSpecies"}, "Author"]ExampleData[{"Text", "OriginOfSpecies"}, "FullTitle"]Length[ExampleData[{"Text", "OriginOfSpecies"}, "Words"]]利用 "FormattedText" 得到一个带有换行的字符串等等:
StringTake[ExampleData[{"Text", "ToBeOrNotToBe"}, "FormattedText"], 200]NotebookPut[ExampleData[{"Text", "DeclarationOfIndependence"}, "NotebookExpression"]]StringTake[ExampleData[{"Text", "LoremIpsum"}], 200]音频 (3)
应用 (5)
Pane[Style[ExampleData[{"Text", "DeclarationOfIndependence"}, "FormattedText"], 3]]ArrayPlot[ExampleData[{"TestImage", "House"}, "GrayLevels"], ColorFunction -> "Rainbow"]ListContourPlot[Reverse[ExampleData[{"TestImage", "House"}, "GrayLevels"]], ColorFunction -> "Pastel", MaxPlotPoints -> 100]Graphics3D[Table[Translate[ExampleData[{"Geometry3D", "SpaceShuttle"}, "GraphicsComplex"], RandomReal[30, {3}]], {6}]]ListLogLogPlot[Reverse[Sort[Last /@ Tally[ExampleData[{"Text", "OriginOfSpecies"}, "Words"]]]], Joined -> True, Filling -> Axis, PlotRange -> All, Frame -> True]巧妙范例 (3)
ListPlot3D[ExampleData[{"TestImage", "Clock"}, "GrayLevels"], PlotStyle -> Yellow, Mesh -> None]Graphics3D[Line[MapThread[{#, # + #2}&, {ExampleData[{"Geometry3D", "Beethoven"}, "VertexData"], ExampleData[{"Geometry3D", "Beethoven"}, "VertexNormals"]}]]]Text[Row[With[{data = ExampleData[{"Text", "ToBeOrNotToBe"}, "Words"]}, MapIndexed[Style[#, 2Count[Take[data, First[#2]], #]]&, data]], " "]]文本
Wolfram Research (2007),ExampleData,Wolfram 语言函数,https://reference.wolfram.com/language/ref/ExampleData.html (更新于 2016 年).
CMS
Wolfram 语言. 2007. "ExampleData." Wolfram 语言与系统参考资料中心. Wolfram Research. 最新版本 2016. https://reference.wolfram.com/language/ref/ExampleData.html.
APA
Wolfram 语言. (2007). ExampleData. Wolfram 语言与系统参考资料中心. 追溯自 https://reference.wolfram.com/language/ref/ExampleData.html 年
BibTeX
@misc{reference.wolfram_2026_exampledata, author="Wolfram Research", title="{ExampleData}", year="2016", howpublished="\url{https://reference.wolfram.com/language/ref/ExampleData.html}", note=[Accessed: 04-September-2026]}
BibLaTeX
@online{reference.wolfram_2026_exampledata, organization={Wolfram Research}, title={ExampleData}, year={2016}, url={https://reference.wolfram.com/language/ref/ExampleData.html}, note=[Accessed: 04-September-2026]}