ChiDistribution



ChiDistribution
表示一个自由度为 ν 的  分布.
分布.
更多信息

- ChiDistribution[ν] 表示一个
 随机变量的平方根的分布. »
 - ChiDistribution 允许 ν 为任何正实数.
- ChiDistribution 允许 ν 为无量纲量. »
- ChiDistribution 可与诸如 Mean、CDF 和 RandomVariate 等函数联合使用. »
背景
- ChiDistribution[ν] 表示了一个参数为正值 ν 的统计分布:
 分布,参数表示分布的自由度. ν 决定了
  分布的概率密度函数(PDF)的一般形状,根据 ν 的值,PDF 可能是单调递减的也可能是有单个“山峰”(即一个绝对最大值)而在定义域下界附近有潜在奇点的形状.
 - ChiDistribution 是卡方随机变量的平方根的分布. 换句话说,若
 是一个随机变量且
  (其中
(其中  读作“的分布是”),那么
  . 分布为正态分布的独立同分布的随机变量
  、
、 、……、
、……、 之和
之和  也是
也是  分布的. 除了统计显著性之外,
 分布也出现在许多科学应用中,包括理想气体的速度分布,在各种条件下子弹的准确性,以及雷达在流体色散中的效果.
 - RandomVariate 可被用于给出
 分布的一个或多个机器精度或任意精度(后者可用 WorkingPrecision 选项指定)的伪随机变量. Distributed[x,ChiDistribution[ν]],更简洁的写法是 xChiDistribution[ν],可被用于声明随机变量 x 是
  分布的. 这样一个声明之后可用在如 Probability、NProbability、Expectation 以及 NExpectation 这样的函数中.
 - 概率密度函数和累积分布函数可用 PDF[ChiDistribution[ν],x] 和 CDF[ChiDistribution[ν],x] 求得. 平均数、中位数、方差、原点矩及中心矩可分别用 Mean、Median、Variance、Moment 和 CentralMoment 计算.
- DistributionFitTest 可被用于测试给定的数据集是否与
 分布一致,EstimatedDistribution 可被用于根据给定数据估算
  参数化分布,而 FindDistributionParameters 可拟合数据和
  分布. ProbabilityPlot 可被用于生成给定数据的 CDF 相对于符号
  分布的 CDF 的图线,而 QuantilePlot 可被用于生成给定数据的分位数相对于符号
  分布的分位数的图线.
 - TransformedDistribution 可被用于表示转换的
 分布,CensoredDistribution 可被用于表示删截后位于上限值和下限值之间的值分布,而 TruncatedDistribution 可被用于表示截断后位于上限值和下限值之间的值分布. CopulaDistribution 可被用于建立包含了
  分布的高维分布,而 ProductDistribution 可被用于计算包括
  分布在内的,若干个独立分量的联合分布.
 - ChiDistribution 与许多其它分布密切相关. 例如,对
 和
和  ,ChiDistribution[η] 分别等价于 RayleighDistribution[η] 和 MaxwellDistribution[η]. 此外,ChiDistribution 可被看作是更一般的 NakagamiDistribution 的特例,意思是说若 XNakagamiDistribution[m,ω] 是一个独立随机变量,那么
  ,其中 YChiDistribution[2m]. ChiDistribution 也可以从 NoncentralChiSquareDistribution 经过变换得到,它还和 GammaDistribution、NormalDistribution 及 HalfNormalDistribution 密切相关.
范例
打开所有单元 关闭所有单元基本范例 (4)

范围 (8)


在极限时, 分布与 NormalDistribution 具有相同的峰度:
使用无量纲 Quantity 来指定自由度参数 ν:
属性和关系 (8)
当 ν->∞,ChiDistribution[ν] 收敛为一个正态分布:
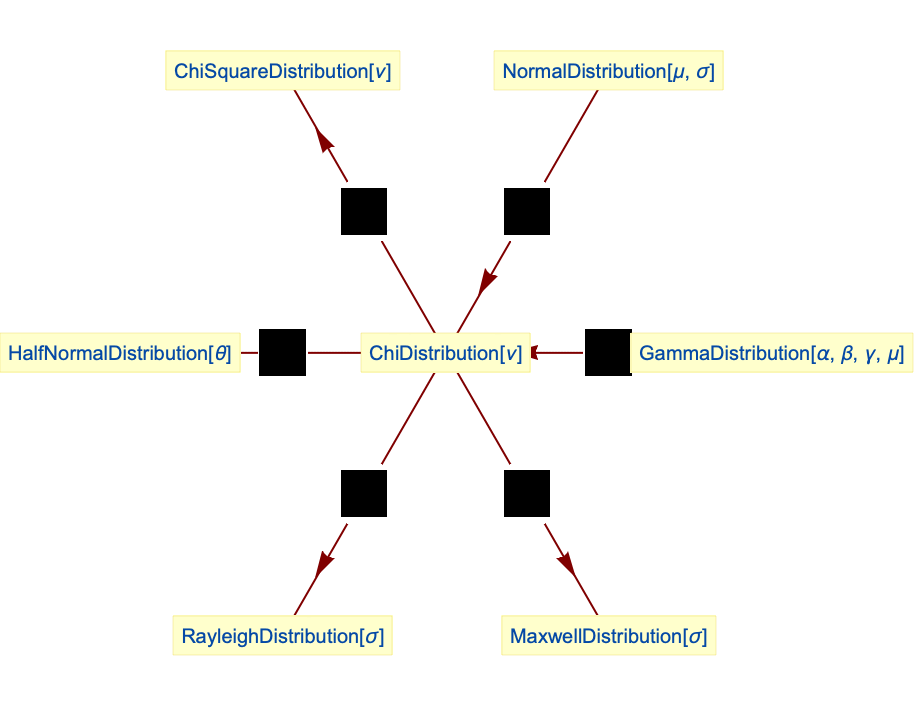
一个  变量的平方服从 ChiSquareDistribution:
 的
的  分布等价于
分布等价于  的 HalfNormalDistribution:
 的
的  分布等价于
分布等价于  的 RayleighDistribution:
 的
的  分布等价于
分布等价于  的 MaxwellDistribution:
 分布是 GammaDistribution 的一个特例:


可能存在的问题 (2)

Wolfram Research (2007),ChiDistribution,Wolfram 语言函数,https://reference.wolfram.com/language/ref/ChiDistribution.html (更新于 2016 年).
文本
Wolfram Research (2007),ChiDistribution,Wolfram 语言函数,https://reference.wolfram.com/language/ref/ChiDistribution.html (更新于 2016 年).
CMS
Wolfram 语言. 2007. "ChiDistribution." Wolfram 语言与系统参考资料中心. Wolfram Research. 最新版本 2016. https://reference.wolfram.com/language/ref/ChiDistribution.html.
APA
Wolfram 语言. (2007). ChiDistribution. Wolfram 语言与系统参考资料中心. 追溯自 https://reference.wolfram.com/language/ref/ChiDistribution.html 年