ComplexStreamPlot
ComplexStreamPlot[f,{z,zmin,zmax}]
更多信息和选项


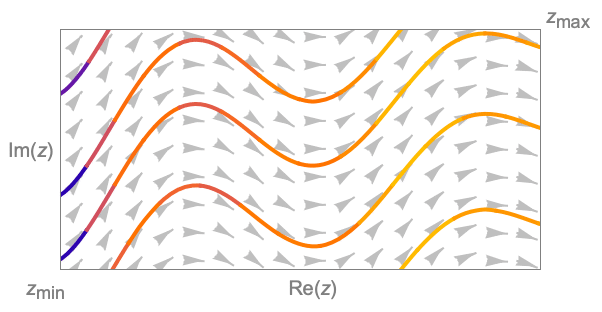
- ComplexStreamPlot 绘制显示每个点处的复向量场的局部方向的流线. 实际上就是求解微分方程
 ,然后绘制
,然后绘制  .
. - 默认情况下,ComplexStreamPlot 会显示足够多的流线以在整个图中展示大致均匀的密度,并且不显示背景标量场.
- 在对 f 等的值进行计算后,在结果不是复数的位置处不显示流线.
- ComplexStreamPlot[f,{z,n}] 等价于 ComplexStreamPlot[f,{z,-n-n I,n+n I}].
- ComplexStreamPlot 具有属性 HoldAll,只在对 z 赋值后才计算 f 等. 某些情况下,先用 Evaluate 对 f 进行符号式计算效率更高.
- ComplexStreamPlot 和 Graphics 有相同的选项,不同之处和更多选项如下所示: [所有选项的列表]
-
AspectRatio 1 长宽比 EvaluationMonitor None 每次运行函数时要计算的表达式 Frame True 是否为图形绘制边框 FrameTicks Automatic 边框刻度标记 Method Automatic 使用何种方法绘图 PerformanceGoal $PerformanceGoal 优化的目标 PlotLegends None 要包含的图例 PlotRange {Full,Full} 包括的 x、y 值的范围 PlotRangePadding Automatic 对数值范围进行多少填充 PlotTheme $PlotTheme 绘图的整体外观主题 RegionBoundaryStyle Automatic 怎样设置绘图区域边界的样式 RegionFillingStyle Automatic 怎样设置绘图区域内部的样式 RegionFunction (True&) 确定要包含的区域 StreamColorFunction Automatic 如何为流线着色 StreamColorFunctionScaling True 是否缩放传递给 StreamColorFunction 的参数 StreamMarkers Automatic 流的形状 StreamPoints Automatic 确定流线的数量、放置和紧密度 StreamScale Automatic 确定单个流线的大小和分段 StreamStyle Automatic 如何绘制流线 WorkingPrecision MachinePrecision 内部计算使用的精度 - 常见的流线标记有:
-

"Segment" 与场方向一致的线段 
"PinDart" 沿场方向的销镖形 
"Dart" 镖形标记 
"Drop" 水滴形标记 - 提供给 RegionFunction 中的函数的参数为
 、
、 . 默认情况下,为 ColorFunction 中的函数提供的是 Re[z]、Im[z]、Abs[z]、Arg[z]、Re[f]、Im[f]、Abs[f]、Arg[f] 经过缩放的值.

所有选项的列表


范例
打开所有单元关闭所有单元范围 (22)
采样 (8)
在赋值前用 Evaluate 符号式计算向量场:
演示 (14)
通过设置 StreamScale 指定不同的分段长度和箭头:
选项 (60)
StreamColorFunction (5)
StreamColorFunctionScaling (3)
StreamMarkers (8)
StreamPoints (5)
StreamScale (9)
StreamStyle (5)
对于颜色,StreamColorFunction 比 StreamStyle 的优先级高:
设置 StreamColorFunctionNone,用 StreamStyle 指定颜色:
应用 (10)
属性和关系 (15)
ComplexStreamPlot 是 StreamPlot 的特例:
ComplexVectorPlot 将复数绘制为向量:
ComplexVectorPlot 是 VectorPlot 的特殊情况:
使用 VectorDisplacementPlot 可视化指定区域内的复函数效果:
用 VectorPlot3D 和 StreamPlot3D 可视化三维向量场:
ComplexContourPlot 绘制复平面上的曲线:
ComplexRegionPlot 绘制复平面上的区域:
ComplexPlot 用颜色显示函数的辐角和幅值:
通过 ComplexPlot3D 用 ![]() 轴显示幅值:
轴显示幅值:
用 ComplexArrayPlot 绘制复数数组:
用 ReImPlot 和 AbsArgPlot 在实平面上绘制复数:
用 ComplexListPlot 显示复数在平面上的位置:
使用 ListVectorPlot 绘制数据:
使用 ListStreamPlot 绘制流线图而非向量:
使用 VectorDensityPlot 添加标量场的密度图:
StreamDensityPlot 可使用流线图而非向量:
使用 ListVectorDensityPlot 生成基于数据的标量场的密度图:
使用 ListStreamDensityPlot 绘制流线图而非向量:
使用 LineIntegralConvolutionPlot 绘制向量场的线积分卷积:
文本
Wolfram Research (2020),ComplexStreamPlot,Wolfram 语言函数,https://reference.wolfram.com/language/ref/ComplexStreamPlot.html (更新于 2020 年).
CMS
Wolfram 语言. 2020. "ComplexStreamPlot." Wolfram 语言与系统参考资料中心. Wolfram Research. 最新版本 2020. https://reference.wolfram.com/language/ref/ComplexStreamPlot.html.
APA
Wolfram 语言. (2020). ComplexStreamPlot. Wolfram 语言与系统参考资料中心. 追溯自 https://reference.wolfram.com/language/ref/ComplexStreamPlot.html 年