PairCorrelationG[pdata,r]
estimates the pair correlation function ![]() for point data pdata at radius r.
for point data pdata at radius r.
PairCorrelationG[pproc,r]
computes ![]() for the point process pproc.
for the point process pproc.
PairCorrelationG[bdata,r]
computes ![]() for binned data bdata.
for binned data bdata.
PairCorrelationG[pspec]
generates the function ![]() that can be applied repeatedly to different radii r.
that can be applied repeatedly to different radii r.


PairCorrelationG
PairCorrelationG[pdata,r]
estimates the pair correlation function ![]() for point data pdata at radius r.
for point data pdata at radius r.
PairCorrelationG[pproc,r]
computes ![]() for the point process pproc.
for the point process pproc.
PairCorrelationG[bdata,r]
computes ![]() for binned data bdata.
for binned data bdata.
PairCorrelationG[pspec]
generates the function ![]() that can be applied repeatedly to different radii r.
that can be applied repeatedly to different radii r.
Details and Options
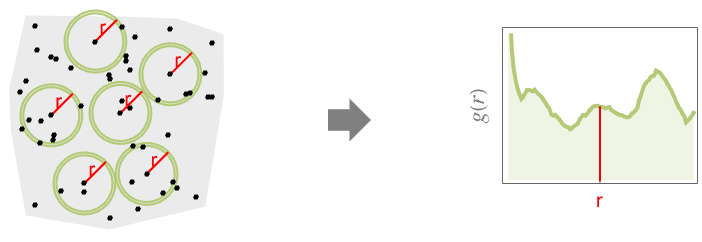
- The product
 where
where  is the mean density is the probability density of finding two points a distance
  apart.
 -
- PairCorrelationG is not a correlation in a usual sense with values varying between
 and 1. The range is from 0 to
  , with 1 corresponding to complete spatial randomness.
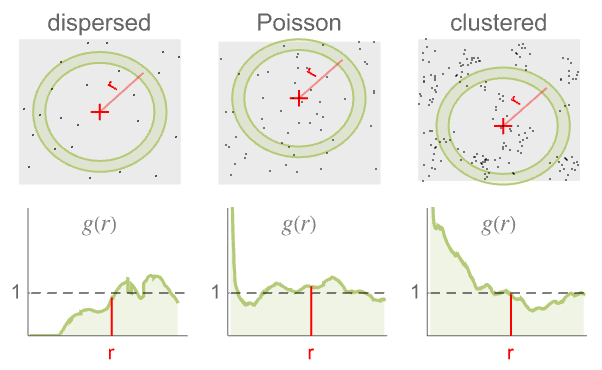
 - PairCorrelationG measures spatial homogeneity of a point collection at distance
 . In comparing with a Poisson point process:
 -

more dispersed than Poisson 
like Poisson, i.e. complete spatial randomness 
more clustered than Poisson -
- For an isotropic stationary point process in
 , the pair correlation function
  is the derivative of Ripley's
  function
  normalized by the measure of a unit sphere
  , where
  is Ripley's
  function and
  is the measure of a unit sphere in
  .
. - The radius r can be a single value or a list of values. With no radius r specified, PairCorrelationG returns a PointStatisticFunction that can be used to evaluate the
 function repeatedly.
 - The points pdata can have the following forms:
-
{p1,p2,…} points pi GeoPosition[…],GeoPositionXYZ[…],… geographic points SpatialPointData[…] spatial point collection {pts,reg} point collection pts and observation region reg - If the observation region reg is not given, a region is automatically computed using RipleyRassonRegion.
- The point process pproc can have the following forms:
-
proc a point process proc {proc,reg} a point process proc and observation region reg - The observation region reg should be parameter free and SpatialObservationRegionQ.
- The binned data bdata is from SpatialBinnedPointData and is treated as an InhomogeneousPoissonPointProcess with a piecewise constant density function.
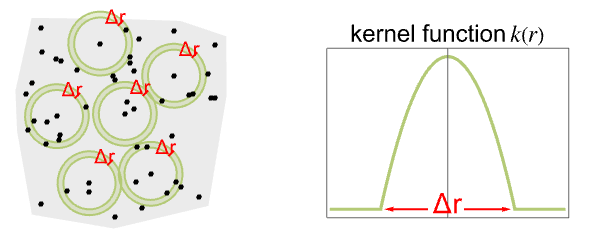
- For pdata,
 is computed using kernel smoothing
  , where additional edge correction is applied. Here
  is the smoothing kernel and
  is the number of points.
 -
- For pproc,
 is computed by using exact formulas or by simulation to generate point data.
 - The following options can be given:
-
Method Automatic what methods to use SpatialBoundaryCorrection Automatic what boundary correction to use - The following settings can be used for SpatialBoundaryCorrection:
-
Automatic automatically determined boundary correction "BorderMargin" use interior margin for observation region None no boundary correction "Ripley" uses weights depending on the point distance to boundary - The setting Method{"Kernel"->kern,"Bandwidth"->bw} allows for choosing the smoothing kernel kern and bandwidth bw in the estimation. Here kern can be any built-in one-dimensional kernel supported by KernelMixtureDistribution, and the bandwidth bw can be Automatic or any positive number.
- By default, "Epanechnikov" kernel is used and the bandwidth is chosen to be
 .
. - PairCorrelationG allows estimating the pair correlation function from PointStatisticFunction generated by RipleyK or BesagL. The estimation is done by smoothing splines. In this situation, the argument pdata has the following forms and interpretations:
-
{PointStatisticFunction[…],{r1,r2,dr}} estimate the pair correlation function based on values sampled at distances Range[r1,r2,dr] {PointStatisticFunction[…],{{r1,r2,…}}} estimate the pair correlation function based on values sampled at distance {r1,r2,...} {PointStatisticFunction[…],rspec,type} same as above with smoothing specified by type - The supported smoothing types are:
-
1 apply smoothing spline to  ; this is used by default
 2 apply smoothing spline to  with constraint
3 apply smoothing spline to  with constraint
4 apply smoothing spline to 
Examples
open all close allBasic Examples (3)
Estimate the pair correlation function at a given radius:
region = Ball[{0, 0}];
pts = RandomPoint[region, 100];PairCorrelationG[{pts, region}, 0.2]Estimate the pair correlation function within a range of distances:
spd = SpatialPointData[RandomReal[1, {500, 2}]]rspec = Range[0.1, 0.4, 0.01];est = PairCorrelationG[spd, rspec];Visualize the result with ListPlot:
ListPlot[est, DataRange -> MinMax[rspec], Filling -> Axis, AxesLabel -> {r}]Pair correlation function of a cluster point process:
pcf = PairCorrelationG[ThomasPointProcess[μ, λ, σ, 2], r]Visualize the function with given parameter values:
Plot[pcf /. {μ -> 3, λ -> 2, σ -> 1}, {r, 0, 3}, AxesLabel -> {r}]Scope (9)
Point Data (6)
Estimate the pair correlation function at distance 0.03:
region = Rectangle[{0, 0}, {1, 2}];
pts = RandomPoint[region, 100];PairCorrelationG[{pts, region}, 0.03]Obtain empirical estimates of the pair correlation function from a list of given distances:
PairCorrelationG[{pts, region}, {0.01, 0.02, 0.05, 0.1}]Use PairCorrelation with SpatialPointData:
spd = SpatialPointData[RandomReal[1, {500, 3}]]res = PairCorrelationG[spd, {0.01, 0.02}]Create a PointStatisticFunction for future use:
reg = Disk[];
pts = RandomPoint[Disk[], 100];psf = PairCorrelationG[{pts, reg}]Compute a value at a given radius:
psf[0.1]Estimate the pair correlation function without explicitly providing the observation region:
BlockRandom[SeedRandom[1];
	pts = RandomReal[1, {100, 2}]
];psf = PairCorrelationG[pts]Observation region generated by Ripley–Rasson estimator:
psf["ObservationRegion"]Estimate the pair correlation function at distance 0.05:
psf[0.05]Use PairCorrelation with GeoPosition:
pts = RandomGeoPosition[GeoDisk[GeoPosition[{0, 0}], Quantity[10, "Kilometers"]], 10 ^ 2]psf = PairCorrelationG[pts]Plot the point statistics function:
ListPlot[Table[{x, psf[x]}, {x, Quantity[0, "km"], psf["MaxRadius"], Quantity[.1, "km"]}], AxesLabel -> {"km"}]Estimate the pair correlation function from ![]() function with different smoothing methods:
function with different smoothing methods:
reg = Ball[];
pts = RandomPoint[reg, 10 ^ 3];rk = RipleyK[{pts, reg}]Estimate pair correlation for given radius range using all four smoothing methods:
rlist = Range[0.01, 0.3, 0.01];
pcfs = PairCorrelationG[{rk, {0, 0.3, 0.01}, #}, rlist]& /@ Range[4];
Visualize the estimated values under different smoothing methods:
ListLinePlot[pcfs, DataRange -> MinMax[rlist], AxesLabel -> {r}, PlotLegends -> (Row[{"smoothing method ", #}]& /@ Range[4])]Point Processes (3)
The pair correlation for PoissonPointProcess is constant:
proc = PoissonPointProcess[μ, d];PairCorrelationG[proc, r]The pair correlation for a cluster process ThomasPointProcess:
proc = ThomasPointProcess[μ, λ, rad, d];PairCorrelationG[proc, r]Visualize for fixed process parameters but varying dimension:
nproc = proc /. {μ -> 20, λ -> 10, rad -> .2};Plot[Table[PairCorrelationG[nproc, r], {d, 1, 4}]//Evaluate, {r, 0, 1}, AxesLabel -> {r}, PlotLegends -> (Row[{#, "D"}]& /@ Range[4])]The pair correlation for a cluster process MaternPointProcess:
proc = MaternPointProcess[μ, λ, σ, d];PairCorrelationG[proc, r]Visualize for fixed process parameters but varying dimension:
nproc = proc /. {μ -> 20, λ -> 10, σ -> .4};Plot[Table[PairCorrelationG[nproc, r], {d, 1, 4}]//Evaluate, {r, 0, 1}, AxesLabel -> {r}, PlotLegends -> (Row[{#, "D"}]& /@ Range[4])]Options (2)
Method (1)
The kernel-smoothing setting can be provided under Method as a suboption:
region = Triangle[{{0, 0}, {1, 2}, {-3, 1}}];
pts = RandomPoint[region, 100];
Estimate the pair correlation function at the same radius with different kernel functions:
PairCorrelationG[{pts, region}, 0.05, Method -> {"Kernel" -> #}]& /@ {"Epanechnikov", "Cosine", "Biweight"}Use different bandwidths to estimate the pair correlation function at the same radius:
PairCorrelationG[{pts, region}, 0.05, Method -> {"Bandwidth" -> #}]& /@ {0.01, 0.02, 0.03}SpatialBoundaryCorrection (1)
The PairCorrelationG estimator without boundary correction is biased and should not be used unless with a large point set:
region = Rectangle[{0, 0}, {1, 2}];
pts = RandomPoint[region, 100];PairCorrelationG[{pts, region}, 0.05, SpatialBoundaryCorrection -> "None"]The default method "BorderMargin" only considers the points that are distance ![]() from the boundary:
from the boundary:
PairCorrelationG[{pts, region}, 0.05, SpatialBoundaryCorrection -> "BorderMargin"]Boundary correction method "Ripley" weights each pair of points to make the estimator unbiased:
PairCorrelationG[{pts, region}, 0.05, SpatialBoundaryCorrection -> "Ripley"]Applications (2)
The pair correlation function under complete spatial randomness:
region = Ellipsoid[{0, 0}, {2, 3}];
pts = RandomPoint[region, 500];
Estimate the values of the pair correlation function with given data:
rspec = Range[0.02, 0.8, 0.02];
data = PairCorrelationG[{pts, region}, rspec];ListPlot[{data, Transpose[{MinMax[rspec], {1, 1}}]}, DataRange -> MinMax[rspec], Joined -> {False, True}, PlotLegends -> {"estimated", "theoretical"}, AxesLabel -> {r}]Compare different edge correction methods:
region = Ball[{0, 0, 0}];
pts = RandomPoint[region, 1000];
Estimate the values of the pair correlation function with three different methods:
rlist = Range[0.02, 0.5, 0.02];
mths = {"None", "BorderMargin", "Ripley"};data = PairCorrelationG[{pts, region}, rlist, SpatialBoundaryCorrection -> #]& /@ mths;Show[Plot[1, {r, 0, Max[rlist]}, PlotStyle -> Gray, PlotLegends -> {"theoretical"}], ListPlot[data, DataRange -> MinMax[rlist], PlotLegends -> mths], AxesLabel -> {r}]Properties & Relations (1)
Estimate the pair correlation function from Ripley's ![]() function:
function:
reg = Disk[];
pts = RandomPoint[reg, 10 ^ 3];rlist = Range[0.01, 0.2, 0.01];pc = PairCorrelationG[{pts, reg}, rlist];ripleyK = RipleyK[pts]pcK = PairCorrelationG[{ripleyK, {0, 0.2, 0.01}}, rlist];Compare the estimate with the pair correlation computed from the data:
ListLinePlot[{pc, pcK}, DataRange -> MinMax@rlist, PlotLegends -> {"PC from data", "PC estimated from K"}, AxesLabel -> {r}]The same estimation can be obtained using Besag's ![]() function:
function:
besagL = BesagL[pts];
pcL = PairCorrelationG[{besagL, {0, 0.2, 0.01}}, rlist];MinMax[pcK - pcL]//ChopText
Wolfram Research (2020), PairCorrelationG, Wolfram Language function, https://reference.wolfram.com/language/ref/PairCorrelationG.html.
CMS
Wolfram Language. 2020. "PairCorrelationG." Wolfram Language & System Documentation Center. Wolfram Research. https://reference.wolfram.com/language/ref/PairCorrelationG.html.
APA
Wolfram Language. (2020). PairCorrelationG. Wolfram Language & System Documentation Center. Retrieved from https://reference.wolfram.com/language/ref/PairCorrelationG.html