

InfiniteLine
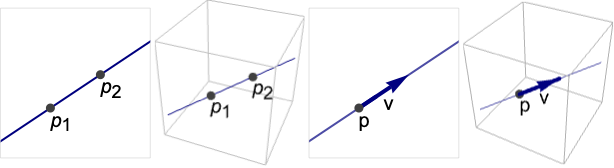
InfiniteLine[{p1,p2}]
点 p1および p2を通る無限の直線を表す.
InfiniteLine[p,v]
点 p を通り v 方向に進む無限の直線を表す.
詳細
- InfiniteLineは線としても知られている.
- InfiniteLineは,幾何学領域として,またグラフィックスプリミティブとして使うことができる.
- InfiniteLineは,線形曲線
 あるいは
 を表す.
- Hyperplane[n,p]は2Dで法線 n を使った別の表現である.
- InfiniteLineはGraphicsおよびGraphics3Dで使うことができる.
- InfiniteLineは,描画される際はPlotRangeで切り取られる.
- グラフィックスでは,点 p,piおよびベクトル v はDynamic式でもよい.
- グラフィックスの描画は,Thickness,Dashing,色等の指示子の影響を受ける.
- InfiniteLineはGeometricSceneの記号的な点と一緒に使うことができる.
例題
すべて開く すべて閉じる例 (3)
2DにおけるInfiniteLine:
Graphics[InfiniteLine[{0, 0}, {1, 1}], Frame -> True]Graphics3D[InfiniteLine[{0, 0, 0}, {1, 2, 3}]]ℛ = InfiniteLine[{0, 0}, {1, 1}];{Graphics[{Red, ℛ}, Frame -> True], Graphics[{Thick, Red, ℛ}, Frame -> True], Graphics[{Thick, Red, Dashed, ℛ}, Frame -> True]}ℛ = InfiniteLine[{0, 0}, {1, 1}];{RegionMember[ℛ, {2, 2}], RegionMember[ℛ, {2, 3}]}スコープ (19)
グラフィックス (8)
指定 (3)
 を含み,
 の方向に進むInfiniteLineを定義する:
ill = Graphics[{PointSize[Medium], Point[{{1, 1}}], Arrowheads[Medium], Thick, Arrow[{{1, 1}, {3, 2}}]}, PlotRange -> {{0, 4}, {0, 3}}, Frame -> True];Show[ill, Graphics[InfiniteLine[{1, 1}, {2, 1}]]]

ill = Graphics[{PointSize[Medium], Point[{{1, 1}, {3, 2}}]}, PlotRange -> {{0, 4}, {0, 3}}, Frame -> True];Show[ill, Graphics[InfiniteLine[{{1, 1}, {3, 2}}]]]

ill = Graphics3D[{PointSize[Medium], Point[{{1, 1, 1}}], Arrowheads[Medium], Thick, Arrow[{{1, 1, 1}, {2, 3, 4}}]}, PlotRange -> {{0, 5}, {0, 5}, {0, 5}}, Axes -> True];Show[ill, Graphics3D[InfiniteLine[{1, 1, 1}, {1, 2, 3}]]]

ill = Graphics3D[{PointSize[Medium], Point[{{1, 1, 1}, {2, 3, 4}}]}, PlotRange -> {{0, 5}, {0, 5}, {0, 5}}, Axes -> True];Show[ill, Graphics3D[InfiniteLine[{{1, 1, 1}, {2, 3, 4}}]]]Table[Graphics[InfiniteLine[{0, 0}, {Cos[θ], Sin[θ]}], ImageSize -> Tiny, PlotLabel -> θ], {θ, 0, π, π / 4}]スタイリング (4)
Table[Graphics[{Thickness[i], InfiniteLine[{{0, 0}, {2, 1}}]}], {i, {.005, .05, .1}}]Table[Graphics[{AbsoluteThickness[i], InfiniteLine[{{0, 0}, {2, 1}}]}], {i, {1, 5, 10}}]破線あるいは点線スタイルを使って無限直線を描画することができる:
Table[Graphics[{Dashing[i], InfiniteLine[{{0, 0}, {2, 1}}]}], {i, {Tiny, Small, Medium, Large}}]Table[Graphics[{d, InfiniteLine[{{0, 0}, {2, 1}}]}], {d, {Dotted, Dashed, DotDashed}}]Table[Graphics[{c, InfiniteLine[{{0, 0}, {2, 1}}]}], {c, {Red, Green, Blue, Yellow}}]Graphics[{Thick, Blue, Dashed, InfiniteLine[{{0, 0}, {2, 1}}]}]座標 (1)
点およびベクトルはDynamicでよい:
DynamicModule[{θ = 0}, {Slider[Dynamic[θ], {0, Pi}], Graphics[InfiniteLine[{0, 0}, Dynamic[{Cos[θ], Sin[θ]}]]]}]領域 (11)
RegionEmbeddingDimension[InfiniteLine[{{x0, y0}, {x1, y1}}]]RegionEmbeddingDimension[InfiniteLine[{x, y, z}, {a, b, c}]]RegionDimension[InfiniteLine[{{x0, y0}, {x1, y1}}]]RegionDimension[InfiniteLine[{x, y, z}, {a, b, c}]]RegionMember[InfiniteLine[{{0, 0, 0}, {1, 1, 1}}], {2, 2, 2}]RegionMember[InfiniteLine[{1, 1}, {2, 2}], {0, -1}]RegionMember[InfiniteLine[{{x0, y0}, {x1, y1}}], {x, y}]ℛ = InfiniteLine[{{0, 0}, {1, 1}}];BoundedRegionQ[ℛ]RegionBounds[ℛ]InfiniteLineの測度は無限である:
ℛ = InfiniteLine[{{0, 0}, {1, 1}}];RegionMeasure[ℛ]RegionCentroid[ℛ]ℛ = InfiniteLine[{{2, 2}, {3, 3}}];RegionDistance[ℛ, {0, 1}]{Plot3D[Evaluate@RegionDistance[ℛ, {x, y}], {x, -2, 2}, {y, -2, 2}, MeshFunctions -> {#3&}, Mesh -> 5], ContourPlot[Evaluate[RegionDistance[ℛ, {x, y}]], {x, -3, 3}, {y, -3, 3}, Contours -> {{0.5, Red}, {1, Green}, {1.5, Blue}}]}ℛ = InfiniteLine[{{2, 2}, {3, 3}}];SignedRegionDistance[ℛ, {0, -1}]Plot3D[SignedRegionDistance[ℛ, {x, y}], {x, -2, 2}, {y, -2, 2}, MeshFunctions -> {#3&}, Mesh -> 5]ℛ = InfiniteLine[{{2, 2}, {3, 3}}];RegionNearest[ℛ, {5, 6}]pts = Table[{1, 2} + 5{Cos[k 2 π / 16], Sin[k 2π / 16]}, {k, 0., 15}];
nst = RegionNearest[ℛ, #]& /@ pts;Legended[Graphics[{{Gray, ℛ}, {Thin, Gray, Line[Transpose[{pts, nst}]]}, {Red, Point[pts]}, {Blue, Point[nst]}}], PointLegend[{Red, Blue}, {"start", "nearest"}]]ℛ = InfiniteLine[{{0, 0}, {1, 1}}];Integrate[Exp[-x y], {x, y}∈ℛ]ℛ = InfiniteLine[{0, 0}, {1, 1}];Minimize[{(x y - 1)^2 + 3, {x, y}∈ℛ}, {x, y}]ℛ = InfiniteLine[{0, 0, 0}, {1, 2, 3}];Solve[x^2 + y^2 + z^2 == 1 && {x, y, z}∈ℛ, {x, y, z}]Graphics3D[{{Opacity[0.5], Sphere[]}, ℛ, {Red, PointSize[Large], Point[{x, y, z} /. %]}}]アプリケーション (17)

lines = Table[InfiniteLine[{0, y}, {1, 1}], {y, 5}];Graphics[lines, PlotRange -> {{-6, 6}, {0, 6}}]asym = InfiniteLine[{0, 0}, {1, 1}];Plot[(x ^ 2 + x + 1/x + 1), {x, -1, 7}, Epilog -> {Red, Dashed, asym}, PlotRange -> 7]ParametricPlot[{t + Cos[14 t] / t, t + Sin[14 t] / t}, {t, 0.01, 10}, Epilog -> {Red, Dashed, asym}]線の切片型をInfiniteLineに変換する:
a = 2;
b = 3;ir = ImplicitRegion[(x/a) + (y/b) == 1, {x, y}];il = InfiniteLine[{{a, 0}, {0, b}}];Table[RegionPlot[r, PlotRange -> {{0, 3}, {0, 3}}], {r, {ir, il}}]線の点傾き型をInfiniteLineに変換する:
m = 2 / 3;
{x0, y0} = {1, 2};ir = ImplicitRegion[y - y0 == m(x - x0), {x, y}];il = InfiniteLine[{x0, y0}, {1, m}];Table[RegionPlot[r, PlotRange -> {{0, 3}, {0, 3}}], {r, {ir, il}}]線の傾き切片型をInfiniteLineに変換する:
m = 2 / 3;
b = 1;ir = ImplicitRegion[y == m x + b, {x, y}];il = InfiniteLine[{0, b}, {1, m}];Table[RegionPlot[r, PlotRange -> {{0, 3}, {0, 3}}], {r, {ir, il}}]線の2点型をInfiniteLineに変換する:
{x0, y0} = {0, 2};
{x1, y1} = {3, 1};ir = ImplicitRegion[y - y0 == (y1 - y0/x1 - x0)(x - x0), {x, y}];il = InfiniteLine[{{x0, y0}, {x1, y1}}];Table[RegionPlot[r, PlotRange -> {{0, 3}, {0, 3}}], {r, {ir, il}}]線のパラメトリック型をInfiniteLineに変換する:
a = 2;
b = 3;
{x0, y0} = {1, 2};pr = ParametricRegion[{x0 + a t, y0 + b t}, {t}];il = InfiniteLine[{{x0, y0}, {x0 + a, y0 + b}}];Table[RegionPlot[r, PlotRange -> {{0, 3}, {0, 3}}], {r, {pr, il}}]パラメトリック曲線 f[u]に対する接線はInfiniteLine[f[u],f'[u]]で与えられる.パラメトリック曲線 に対する接線を求める:
f1[u_] := {Cos[u], Sin[u]};c1 = ParametricPlot[f1[u], {u, 0, 2π}];
t1 = With[{u = π / 4}, Graphics[InfiniteLine[f1[u], f1'[u]]]];Show[c1, t1, PlotRange -> {{-2, 2}, {-2, 2}}]
f2[u_] := {Cos[u], Sin[u], u / 10};c2 = ParametricPlot3D[f2[t], {t, 0, 20}];
t2 = With[{u = 4}, Graphics3D[InfiniteLine[f2[u], f2'[u]]]];Show[c2, t2, PlotRange -> {{-2, 2}, {-2, 2}, All}]InfiniteLine[{0,0},{1,1}]とInfiniteLine[{{0,1},{1,0}}]の交点を求める:
line1 = InfiniteLine[{0, 0}, {1, 1}];
line2 = InfiniteLine[{{0, 1}, {1, 0}}];sol = Solve[{x, y}∈line1∧{x, y}∈line2, {x, y}]Graphics[{{Lighter[Blue, 0.5], line1, line2}, {Red, Point[{x, y} /. sol]}}, Axes -> True, ImageSize -> Small]InfiniteLine[{0,0},{1,1}]とCircle[{0,0},1]の交点を求める:
line = InfiniteLine[{0, 0}, {1, 1}];
circle = Circle[{0, 0}, 1];sol = Solve[{x, y}∈line∧{x, y}∈circle, {x, y}]Graphics[{{Lighter[Blue, 0.5], line, circle}, {Red, Point[{x, y} /. sol]}}, ImageSize -> Small]lines = InfiniteLine /@ RandomReal[1, {5, 2, 2}];BooleanCountingFunctionを使い,厳密に2つの条件が真であることを表す:
sol = NSolve[{x, y}∈BooleanRegion[BooleanCountingFunction[{2}, 5], lines], {x, y}]Graphics[{{Lighter[Blue, 0.5], lines}, {Red, PointSize[Medium], Point[{x, y} /. sol]}}]InfiniteLine[{{-1,1,1},{1,1,1}}]とInfinitePlane[{{2,0,0},{0,2,0},{0,0,2}}]の交点を求める:
line = InfiniteLine[{{-1, 1, 1}, {1, 1, 1}}];
plane = InfinitePlane[{{2, 0, 0}, {0, 2, 0}, {0, 0, 2}}];sol = Solve[{{x, y, z}∈line, {x, y, z}∈plane}, {x, y, z}]Graphics3D[{{Opacity[0.5], line, plane}, {Red, PointSize[Large], Point[{x, y, z} /. sol]}}, Axes -> True, PlotRange -> {{-2, 2}, {-2, 2}, {-2, 2}}]InfiniteLine[{{-1,1,1},{1,1,1}}]とSphere[{0,0,0},3]の交点を求める:
line = InfiniteLine[{{-1, 1, 1}, {1, 1, 1}}];
sphere = Sphere[{0, 0, 0}, 3];sol = Solve[{{x, y, z}∈line, {x, y, z}∈sphere}, {x, y, z}]Graphics3D[{{Opacity[0.5], line, sphere}, {Red, PointSize[Large], Point[{x, y, z} /. sol]}}, PlotRangePadding -> 0.5]InfiniteLine[{{-1,1/3,1/2},{1,1/3,1/2}}]とTetrahedron[{{0,0,0},{1,0,0},{0,1,0},{0,0,1}}]の境界との交点を求める:
line = InfiniteLine[{{-1, 1 / 3, 1 / 2}, {1, 1 / 3, 1 / 2}}];
tet = RegionBoundary@Tetrahedron[{{0, 0, 0}, {1, 0, 0}, {0, 1, 0}, {0, 0, 1}}];sol = Solve[{x, y, z}∈RegionIntersection[line, tet], {x, y, z}]Graphics3D[{{Opacity[0.5], line, Tetrahedron[{{0, 0, 0}, {1, 0, 0}, {0, 1, 0}, {0, 0, 1}}]}, {Red, PointSize[Medium], Point[{x, y, z} /. sol]}}, PlotRangePadding -> 0.2]data = RandomVariate[NormalDistribution[1, 9], 200];h = Histogram[data];m = Graphics[{Dashed, Red, InfiniteLine[{Mean[data], 0}, {0, 1}]}];Show[h, m]RotationTransformの回転軸を可視化する:
v = {4, 2, -5};
p = {2, 2, 3 / 2};axis = InfiniteLine[p, v];rt[θ_] := RotationTransform[θ, v, p];g = Graphics3D[Table[{GeometricTransformation[Sphere[], rt[θ]]}, {θ, 0, 2Pi, 2Pi / 8}], Boxed -> False];Show[g, Graphics3D[{Thick, Blue, Dashed, axis}]]{a, b, c} = {{0, 0}, {3, 0}, {-1, 2}};base = InfiniteLine[{a, b}];foot = RegionNearest[base, c];altitude = Line[{c, foot}];Graphics[{{LightBlue, Triangle[{a, b, c}]}, {Thick, Darker@LightBlue, base}, {PointSize@Medium, Red, Point[{c, foot}]}, {Dashed, Red, altitude}}]特性と関係 (5)
InfiniteLine[{p1,p2}]はInfiniteLine[p1,p2-p1]に等しい:
Subscript[ℛ, 1] = InfiniteLine[{{1, 0}, {2, 2}}];
Subscript[ℛ, 2] = InfiniteLine[{1, 0}, {1, 2}];RegionEqual[Subscript[ℛ, 1], Subscript[ℛ, 2]]InfiniteLine[p,v]は2DのHyperplane[Cross[v],p]に等しい:
Subscript[ℛ, 1] = InfiniteLine[{1, 2}, {1, 1}];Subscript[ℛ, 2] = Hyperplane[Cross[{1, 1}], {1, 2}];RegionEqual[Subscript[ℛ, 1], Subscript[ℛ, 2]]ParametricRegionは任意のInfiniteLineを表すことができる:
Subscript[ℛ, 1] = ParametricRegion[{1, 2} + t{3, 4}, {t}];
Subscript[ℛ, 2] = InfiniteLine[{1, 2}, {3, 4}];RegionEqual[Subscript[ℛ, 1], Subscript[ℛ, 2]]ImplicitRegionは任意のInfiniteLineを表すことができる:
Subscript[ℛ, 1] = ImplicitRegion[y - x == 1, {x, y}];
Subscript[ℛ, 2] = InfiniteLine[{{1, 2}, {3, 4}}];RegionEqual[Subscript[ℛ, 1], Subscript[ℛ, 2]]InfiniteLineはConicHullRegionの特殊ケースである:
pts = {{1, 2}, {3, 4}};RegionEqual[ConicHullRegion[pts], InfiniteLine[pts]]おもしろい例題 (2)
Graphics[Table[{Hue[RandomReal[]], InfiniteLine[RandomReal[1, {2, 2}]]}, {50}]]Graphics3D[Table[{Hue[RandomReal[]], InfiniteLine[RandomReal[1, {2, 3}]]}, {100}], BoxRatios -> 1]Graphics[Table[InfiniteLine[{0, 0}, {Cos[θ], Sin[θ]}], {θ, 0., π, π / 50}]]Graphics[Table[InfiniteLine[{Cos[θ], Sin[θ]}, {-Sin[θ], Cos[θ]}], {θ, 0, 2π, π / 20}], PlotRange -> 2]テキスト
Wolfram Research (2014), InfiniteLine, Wolfram言語関数, https://reference.wolfram.com/language/ref/InfiniteLine.html.
CMS
Wolfram Language. 2014. "InfiniteLine." Wolfram Language & System Documentation Center. Wolfram Research. https://reference.wolfram.com/language/ref/InfiniteLine.html.
APA
Wolfram Language. (2014). InfiniteLine. Wolfram Language & System Documentation Center. Retrieved from https://reference.wolfram.com/language/ref/InfiniteLine.html