

InfiniteLine
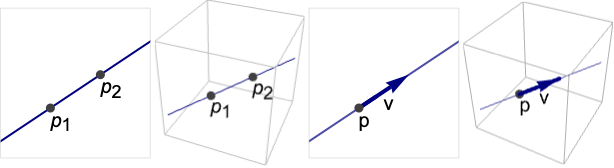
InfiniteLine[{p1,p2}]
表示经过点 p1 和 p2 的无限长直线.
InfiniteLine[p,v]
表示经过点 p,方向为 v 的无限长直线.
更多信息
- InfiniteLine 也被称为线.
- InfiniteLine 可被用作几何区域及图形基元.
- InfiniteLine 表示线性曲线
 或
 .
- Hyperplane[n,p] 是在 2D 中使用法线 n 的替代表示.
- InfiniteLine 可用在 Graphics 和 Graphics3D 中.
- 进行渲染时 InfiniteLine 会被 PlotRange 修剪.
- 在图形中,点 p、pi 和矢量 v 可以是 Dynamic 表达式.
- 有些指令,比如 Thickness、Dashing 和着色会影响图形渲染.
- InfiniteLine 可与 GeometricScene 中的符号点一起使用.
范例
打开所有单元 关闭所有单元基本范例 (3)
二维 InfiniteLine:
Graphics[InfiniteLine[{0, 0}, {1, 1}], Frame -> True]Graphics3D[InfiniteLine[{0, 0, 0}, {1, 2, 3}]]ℛ = InfiniteLine[{0, 0}, {1, 1}];{Graphics[{Red, ℛ}, Frame -> True], Graphics[{Thick, Red, ℛ}, Frame -> True], Graphics[{Thick, Red, Dashed, ℛ}, Frame -> True]}ℛ = InfiniteLine[{0, 0}, {1, 1}];{RegionMember[ℛ, {2, 2}], RegionMember[ℛ, {2, 3}]}范围 (19)
图形 (8)
规范 (3)
定义一条包含  方向为
 的 InfiniteLine:
ill = Graphics[{PointSize[Medium], Point[{{1, 1}}], Arrowheads[Medium], Thick, Arrow[{{1, 1}, {3, 2}}]}, PlotRange -> {{0, 4}, {0, 3}}, Frame -> True];Show[ill, Graphics[InfiniteLine[{1, 1}, {2, 1}]]]

ill = Graphics[{PointSize[Medium], Point[{{1, 1}, {3, 2}}]}, PlotRange -> {{0, 4}, {0, 3}}, Frame -> True];Show[ill, Graphics[InfiniteLine[{{1, 1}, {3, 2}}]]]

ill = Graphics3D[{PointSize[Medium], Point[{{1, 1, 1}}], Arrowheads[Medium], Thick, Arrow[{{1, 1, 1}, {2, 3, 4}}]}, PlotRange -> {{0, 5}, {0, 5}, {0, 5}}, Axes -> True];Show[ill, Graphics3D[InfiniteLine[{1, 1, 1}, {1, 2, 3}]]]

ill = Graphics3D[{PointSize[Medium], Point[{{1, 1, 1}, {2, 3, 4}}]}, PlotRange -> {{0, 5}, {0, 5}, {0, 5}}, Axes -> True];Show[ill, Graphics3D[InfiniteLine[{{1, 1, 1}, {2, 3, 4}}]]]Table[Graphics[InfiniteLine[{0, 0}, {Cos[θ], Sin[θ]}], ImageSize -> Tiny, PlotLabel -> θ], {θ, 0, π, π / 4}]样式 (4)
Table[Graphics[{Thickness[i], InfiniteLine[{{0, 0}, {2, 1}}]}], {i, {.005, .05, .1}}]Table[Graphics[{AbsoluteThickness[i], InfiniteLine[{{0, 0}, {2, 1}}]}], {i, {1, 5, 10}}]Table[Graphics[{Dashing[i], InfiniteLine[{{0, 0}, {2, 1}}]}], {i, {Tiny, Small, Medium, Large}}]Table[Graphics[{d, InfiniteLine[{{0, 0}, {2, 1}}]}], {d, {Dotted, Dashed, DotDashed}}]Table[Graphics[{c, InfiniteLine[{{0, 0}, {2, 1}}]}], {c, {Red, Green, Blue, Yellow}}]Graphics[{Thick, Blue, Dashed, InfiniteLine[{{0, 0}, {2, 1}}]}]坐标 (1)
点和矢量可以是 Dynamic 表达式:
DynamicModule[{θ = 0}, {Slider[Dynamic[θ], {0, Pi}], Graphics[InfiniteLine[{0, 0}, Dynamic[{Cos[θ], Sin[θ]}]]]}]区域 (11)
RegionEmbeddingDimension[InfiniteLine[{{x0, y0}, {x1, y1}}]]RegionEmbeddingDimension[InfiniteLine[{x, y, z}, {a, b, c}]]RegionDimension[InfiniteLine[{{x0, y0}, {x1, y1}}]]RegionDimension[InfiniteLine[{x, y, z}, {a, b, c}]]RegionMember[InfiniteLine[{{0, 0, 0}, {1, 1, 1}}], {2, 2, 2}]RegionMember[InfiniteLine[{1, 1}, {2, 2}], {0, -1}]RegionMember[InfiniteLine[{{x0, y0}, {x1, y1}}], {x, y}]ℛ = InfiniteLine[{{0, 0}, {1, 1}}];BoundedRegionQ[ℛ]RegionBounds[ℛ]InfiniteLine 的度量为无限大:
ℛ = InfiniteLine[{{0, 0}, {1, 1}}];RegionMeasure[ℛ]RegionCentroid[ℛ]ℛ = InfiniteLine[{{2, 2}, {3, 3}}];RegionDistance[ℛ, {0, 1}]{Plot3D[Evaluate@RegionDistance[ℛ, {x, y}], {x, -2, 2}, {y, -2, 2}, MeshFunctions -> {#3&}, Mesh -> 5], ContourPlot[Evaluate[RegionDistance[ℛ, {x, y}]], {x, -3, 3}, {y, -3, 3}, Contours -> {{0.5, Red}, {1, Green}, {1.5, Blue}}]}ℛ = InfiniteLine[{{2, 2}, {3, 3}}];SignedRegionDistance[ℛ, {0, -1}]Plot3D[SignedRegionDistance[ℛ, {x, y}], {x, -2, 2}, {y, -2, 2}, MeshFunctions -> {#3&}, Mesh -> 5]ℛ = InfiniteLine[{{2, 2}, {3, 3}}];RegionNearest[ℛ, {5, 6}]pts = Table[{1, 2} + 5{Cos[k 2 π / 16], Sin[k 2π / 16]}, {k, 0., 15}];
nst = RegionNearest[ℛ, #]& /@ pts;Legended[Graphics[{{Gray, ℛ}, {Thin, Gray, Line[Transpose[{pts, nst}]]}, {Red, Point[pts]}, {Blue, Point[nst]}}], PointLegend[{Red, Blue}, {"start", "nearest"}]]ℛ = InfiniteLine[{{0, 0}, {1, 1}}];Integrate[Exp[-x y], {x, y}∈ℛ]ℛ = InfiniteLine[{0, 0}, {1, 1}];Minimize[{(x y - 1)^2 + 3, {x, y}∈ℛ}, {x, y}]ℛ = InfiniteLine[{0, 0, 0}, {1, 2, 3}];Solve[x^2 + y^2 + z^2 == 1 && {x, y, z}∈ℛ, {x, y, z}]Graphics3D[{{Opacity[0.5], Sphere[]}, ℛ, {Red, PointSize[Large], Point[{x, y, z} /. %]}}]应用 (17)

lines = Table[InfiniteLine[{0, y}, {1, 1}], {y, 5}];Graphics[lines, PlotRange -> {{-6, 6}, {0, 6}}]asym = InfiniteLine[{0, 0}, {1, 1}];Plot[(x ^ 2 + x + 1/x + 1), {x, -1, 7}, Epilog -> {Red, Dashed, asym}, PlotRange -> 7]ParametricPlot[{t + Cos[14 t] / t, t + Sin[14 t] / t}, {t, 0.01, 10}, Epilog -> {Red, Dashed, asym}]将直线的截距式转换为 InfiniteLine:
a = 2;
b = 3;ir = ImplicitRegion[(x/a) + (y/b) == 1, {x, y}];il = InfiniteLine[{{a, 0}, {0, b}}];Table[RegionPlot[r, PlotRange -> {{0, 3}, {0, 3}}], {r, {ir, il}}]将直线的点斜式转换为 InfiniteLine:
m = 2 / 3;
{x0, y0} = {1, 2};ir = ImplicitRegion[y - y0 == m(x - x0), {x, y}];il = InfiniteLine[{x0, y0}, {1, m}];Table[RegionPlot[r, PlotRange -> {{0, 3}, {0, 3}}], {r, {ir, il}}]将直线的斜截式转换为 InfiniteLine:
m = 2 / 3;
b = 1;ir = ImplicitRegion[y == m x + b, {x, y}];il = InfiniteLine[{0, b}, {1, m}];Table[RegionPlot[r, PlotRange -> {{0, 3}, {0, 3}}], {r, {ir, il}}]将直线的两点式转换为 InfiniteLine:
{x0, y0} = {0, 2};
{x1, y1} = {3, 1};ir = ImplicitRegion[y - y0 == (y1 - y0/x1 - x0)(x - x0), {x, y}];il = InfiniteLine[{{x0, y0}, {x1, y1}}];Table[RegionPlot[r, PlotRange -> {{0, 3}, {0, 3}}], {r, {ir, il}}]将直线的参数式转换为 InfiniteLine:
a = 2;
b = 3;
{x0, y0} = {1, 2};pr = ParametricRegion[{x0 + a t, y0 + b t}, {t}];il = InfiniteLine[{{x0, y0}, {x0 + a, y0 + b}}];Table[RegionPlot[r, PlotRange -> {{0, 3}, {0, 3}}], {r, {pr, il}}]参数式曲线 f[u] 的切线为 InfiniteLine[f[u],f'[u]]. 计算参数式曲线  的切线:
f1[u_] := {Cos[u], Sin[u]};c1 = ParametricPlot[f1[u], {u, 0, 2π}];
t1 = With[{u = π / 4}, Graphics[InfiniteLine[f1[u], f1'[u]]]];Show[c1, t1, PlotRange -> {{-2, 2}, {-2, 2}}]
f2[u_] := {Cos[u], Sin[u], u / 10};c2 = ParametricPlot3D[f2[t], {t, 0, 20}];
t2 = With[{u = 4}, Graphics3D[InfiniteLine[f2[u], f2'[u]]]];Show[c2, t2, PlotRange -> {{-2, 2}, {-2, 2}, All}]计算 InfiniteLine[{0,0},{1,1}] 和 InfiniteLine[{{0,1},{1,0}}] 的交点:
line1 = InfiniteLine[{0, 0}, {1, 1}];
line2 = InfiniteLine[{{0, 1}, {1, 0}}];sol = Solve[{x, y}∈line1∧{x, y}∈line2, {x, y}]Graphics[{{Lighter[Blue, 0.5], line1, line2}, {Red, Point[{x, y} /. sol]}}, Axes -> True, ImageSize -> Small]计算 InfiniteLine[{0,0},{1,1}] 和 Circle[{0,0},1] 的交点:
line = InfiniteLine[{0, 0}, {1, 1}];
circle = Circle[{0, 0}, 1];sol = Solve[{x, y}∈line∧{x, y}∈circle, {x, y}]Graphics[{{Lighter[Blue, 0.5], line, circle}, {Red, Point[{x, y} /. sol]}}, ImageSize -> Small]lines = InfiniteLine /@ RandomReal[1, {5, 2, 2}];利用 BooleanCountingFunction 来表示恰好满足两个条件的情况:
sol = NSolve[{x, y}∈BooleanRegion[BooleanCountingFunction[{2}, 5], lines], {x, y}]Graphics[{{Lighter[Blue, 0.5], lines}, {Red, PointSize[Medium], Point[{x, y} /. sol]}}]计算 InfiniteLine[{{-1,1,1},{1,1,1}}] 和 InfinitePlane[{{2,0,0},{0,2,0},{0,0,2}}] 的交点:
line = InfiniteLine[{{-1, 1, 1}, {1, 1, 1}}];
plane = InfinitePlane[{{2, 0, 0}, {0, 2, 0}, {0, 0, 2}}];sol = Solve[{{x, y, z}∈line, {x, y, z}∈plane}, {x, y, z}]Graphics3D[{{Opacity[0.5], line, plane}, {Red, PointSize[Large], Point[{x, y, z} /. sol]}}, Axes -> True, PlotRange -> {{-2, 2}, {-2, 2}, {-2, 2}}]计算 InfiniteLine[{{-1,1,1},{1,1,1}}] 和 Sphere[{0,0,0},3] 的交点:
line = InfiniteLine[{{-1, 1, 1}, {1, 1, 1}}];
sphere = Sphere[{0, 0, 0}, 3];sol = Solve[{{x, y, z}∈line, {x, y, z}∈sphere}, {x, y, z}]Graphics3D[{{Opacity[0.5], line, sphere}, {Red, PointSize[Large], Point[{x, y, z} /. sol]}}, PlotRangePadding -> 0.5]计算 InfiniteLine[{{-1,1/3,1/2},{1,1/3,1/2}}] 和 Tetrahedron[{{0,0,0},{1,0,0},{0,1,0},{0,0,1}}] 的表面的交点:
line = InfiniteLine[{{-1, 1 / 3, 1 / 2}, {1, 1 / 3, 1 / 2}}];
tet = RegionBoundary@Tetrahedron[{{0, 0, 0}, {1, 0, 0}, {0, 1, 0}, {0, 0, 1}}];sol = Solve[{x, y, z}∈RegionIntersection[line, tet], {x, y, z}]Graphics3D[{{Opacity[0.5], line, Tetrahedron[{{0, 0, 0}, {1, 0, 0}, {0, 1, 0}, {0, 0, 1}}]}, {Red, PointSize[Medium], Point[{x, y, z} /. sol]}}, PlotRangePadding -> 0.2]data = RandomVariate[NormalDistribution[1, 9], 200];h = Histogram[data];m = Graphics[{Dashed, Red, InfiniteLine[{Mean[data], 0}, {0, 1}]}];Show[h, m]可视化 RotationTransform 的旋转轴:
v = {4, 2, -5};
p = {2, 2, 3 / 2};axis = InfiniteLine[p, v];rt[θ_] := RotationTransform[θ, v, p];g = Graphics3D[Table[{GeometricTransformation[Sphere[], rt[θ]]}, {θ, 0, 2Pi, 2Pi / 8}], Boxed -> False];Show[g, Graphics3D[{Thick, Blue, Dashed, axis}]]{a, b, c} = {{0, 0}, {3, 0}, {-1, 2}};base = InfiniteLine[{a, b}];foot = RegionNearest[base, c];altitude = Line[{c, foot}];Graphics[{{LightBlue, Triangle[{a, b, c}]}, {Thick, Darker@LightBlue, base}, {PointSize@Medium, Red, Point[{c, foot}]}, {Dashed, Red, altitude}}]属性和关系 (5)
InfiniteLine[{p1,p2}] 等价于 InfiniteLine[p1,p2-p1]:
Subscript[ℛ, 1] = InfiniteLine[{{1, 0}, {2, 2}}];
Subscript[ℛ, 2] = InfiniteLine[{1, 0}, {1, 2}];RegionEqual[Subscript[ℛ, 1], Subscript[ℛ, 2]]在二维空间,InfiniteLine[p,v] 等价于 Hyperplane[Cross[v],p]:
Subscript[ℛ, 1] = InfiniteLine[{1, 2}, {1, 1}];Subscript[ℛ, 2] = Hyperplane[Cross[{1, 1}], {1, 2}];RegionEqual[Subscript[ℛ, 1], Subscript[ℛ, 2]]ParametricRegion 可以表示任意 InfiniteLine:
Subscript[ℛ, 1] = ParametricRegion[{1, 2} + t{3, 4}, {t}];
Subscript[ℛ, 2] = InfiniteLine[{1, 2}, {3, 4}];RegionEqual[Subscript[ℛ, 1], Subscript[ℛ, 2]]ImplicitRegion 可以表示任意 InfiniteLine:
Subscript[ℛ, 1] = ImplicitRegion[y - x == 1, {x, y}];
Subscript[ℛ, 2] = InfiniteLine[{{1, 2}, {3, 4}}];RegionEqual[Subscript[ℛ, 1], Subscript[ℛ, 2]]InfiniteLine 是 ConicHullRegion 的一个特例:
pts = {{1, 2}, {3, 4}};RegionEqual[ConicHullRegion[pts], InfiniteLine[pts]]巧妙范例 (2)
Graphics[Table[{Hue[RandomReal[]], InfiniteLine[RandomReal[1, {2, 2}]]}, {50}]]Graphics3D[Table[{Hue[RandomReal[]], InfiniteLine[RandomReal[1, {2, 3}]]}, {100}], BoxRatios -> 1]Graphics[Table[InfiniteLine[{0, 0}, {Cos[θ], Sin[θ]}], {θ, 0., π, π / 50}]]Graphics[Table[InfiniteLine[{Cos[θ], Sin[θ]}, {-Sin[θ], Cos[θ]}], {θ, 0, 2π, π / 20}], PlotRange -> 2]文本
Wolfram Research (2014),InfiniteLine,Wolfram 语言函数,https://reference.wolfram.com/language/ref/InfiniteLine.html.
CMS
Wolfram 语言. 2014. "InfiniteLine." Wolfram 语言与系统参考资料中心. Wolfram Research. https://reference.wolfram.com/language/ref/InfiniteLine.html.
APA
Wolfram 语言. (2014). InfiniteLine. Wolfram 语言与系统参考资料中心. 追溯自 https://reference.wolfram.com/language/ref/InfiniteLine.html 年