PairwiseSmoothDensityHistogram
PairwiseSmoothDensityHistogram[{{y11,…,y1n},…,{ym1,…,ymn}}]
通过成对绘制数据列来创建平滑密度直方图数组.
更多信息和选项


- PairwiseSmoothDensityHistogram 是绘图矩阵的一种形式.
- 它通过在网格中逐一绘制每两个数据列的单独图,对高维数据进行可视化.
- 该图通过在面板 {i,j} 中绘制点 {ykj,yki} 的平滑密度直方图来比较列 yi={y1i,y2i,…,ymi} 与列 yj={y1j,y2j,…,ymj}.
- 第
 行和第
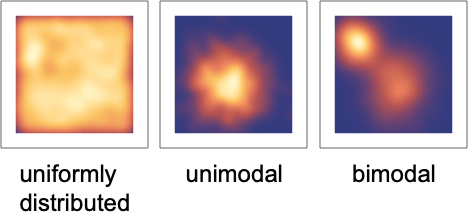
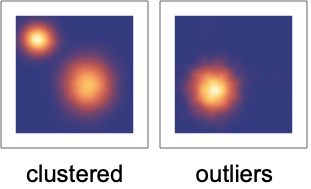
行和第  列的面板显示数据列 yi 和 yj 之间的关系. 可以从这些面板中识别出数据的不同特征. 一旦特征被识别出,还可以通过进一步分析数据来量化它.
 - 相关性和协方差是衡量变量之间关联程度的指标:
- 使用 Correlation 和 Covariance 进行详细的相关性分析.
- 点的密度是每单位面积上点的数量的度量. 在 PairwiseSmoothDensityHistogram 中的面板有效地显示了二维边际密度:
- 使用 PairwiseDensityHistogram 和 PairwiseSmoothDensityHistogram 更直观地可视化这些密度.
- 簇是相似点的群组,表示不同的类别:
- PairwiseSmoothDensityHistogram 采用与 Graphics 相同的选项,并具有以下变更和添加: [所有选项的列表]
-
AspectRatio 1 每个面板的高宽比 Background None 每个图使用的背景 Frame Automatic 是否在每个面板周围绘制边框 FrameTicks Automatic 是否在边框边缘标记刻度和标签 GridLines Automatic 是否在面板中包含网格线 GridLinesStyle Automatic 网格线的样式 HeaderAlignment Center 标题的水平和垂直对齐方式 HeaderBackground Automatic 标题使用的背景颜色 HeaderDisplayFunction Automatic 用于格式化标题的函数 Headers Automatic 用于每个数据列 yi 的标签 HeaderStyle None 标题使用的样式 PerformanceGoal $PerformanceGoal 尝试优化的性能方面 PlotHighlighting Automatic 点的突出显示效果 PlotLayout Automatic 如何排列面板 PlotLegends Automatic 数据的图例 PlotMarkers None 用于指示每个点的标记 PlotStyle Automatic 确定点的样式的图形指令 PlotTheme $PlotTheme 图的整体主题 Spacings Automatic 水平和垂直间距 - PlotLayout 可以有以下设置:
-

"Descending" 向下和向右的数据列 
"Ascending" 向上和向右的数据列 
"DescendingHalfMatrix" 降序布局的下半部分 
"AscendingHalfMatrix" 升序布局的上半部分 - Headers 指定数据中每列使用的标签,通常会显示在最终图的每一列上方和每一行之后.
- 可能的设置包括:
-
None 不标记图的列和行 Automatic 自动标记列和行 All 始终包含列和行标签 "Indexed" 给列和行编号为 1、2、…、n {lbl1,lbl2,…,lbln} 使用给定的标签 lbli - HeaderAlignment 确定数据列标签相对于图的列和行的对齐方式.
- HeaderAlignment 可以采用以下形式:
-
Center 将标签居中在标题位置 {h,v} 在标题位置内部将水平和垂直对齐分开 {cols,rows} 对于图表的列使用 col,对于图表的行使用 row - HeaderBackground 和 HeaderStyle 可以采用以下形式:
-
None 使用环境样式 sty 对所有标题使用样式 sty {sty1,sty2,…,styn} 对于连续的标题,使用给定的样式 styi {cols,rows} 对于图的列使用 col,对于图的行使用 row - HeaderDisplayFunction 确定标题如何显示.
- 可能的设置包括:
-
Automatic 自动格式化 None 使用未经处理的标签 - ColorFunction 的参数为 yi1,yi2,…,yin. 默认情况下,颜色函数参数会按数据列进行缩放,使其范围在 0 到 1 之间.
- 使用 ColorFunctionScalingNone 来使用未经缩放的值,或者使用ColorFunctionScaling{cfsc1,cfsc2,…} 来有选择地缩放列值.
- PlotHighlighting 的可能设置包括:
-
Automatic 自动突出显示面板中的位置 None 禁用交互式突出显示


所有选项的列表


范例
打开所有单元关闭所有单元选项 (19)
AspectRatio (2)
GridLines (2)
Headers (3)
HeaderBackground (2)
Wolfram Research (2024),PairwiseSmoothDensityHistogram,Wolfram 语言函数,https://reference.wolfram.com/language/ref/PairwiseSmoothDensityHistogram.html.
文本
Wolfram Research (2024),PairwiseSmoothDensityHistogram,Wolfram 语言函数,https://reference.wolfram.com/language/ref/PairwiseSmoothDensityHistogram.html.
CMS
Wolfram 语言. 2024. "PairwiseSmoothDensityHistogram." Wolfram 语言与系统参考资料中心. Wolfram Research. https://reference.wolfram.com/language/ref/PairwiseSmoothDensityHistogram.html.
APA
Wolfram 语言. (2024). PairwiseSmoothDensityHistogram. Wolfram 语言与系统参考资料中心. 追溯自 https://reference.wolfram.com/language/ref/PairwiseSmoothDensityHistogram.html 年