


PairwiseQuantilePlot
PairwiseQuantilePlot[{{y11,…,y1n},…,{ym1,…,ymn}}]
creates an array of quantile plots by plotting the quantiles of the columns against each other.
Details and Options
- PairwiseQuantilePlot is also known as Q-Q plot matrix.
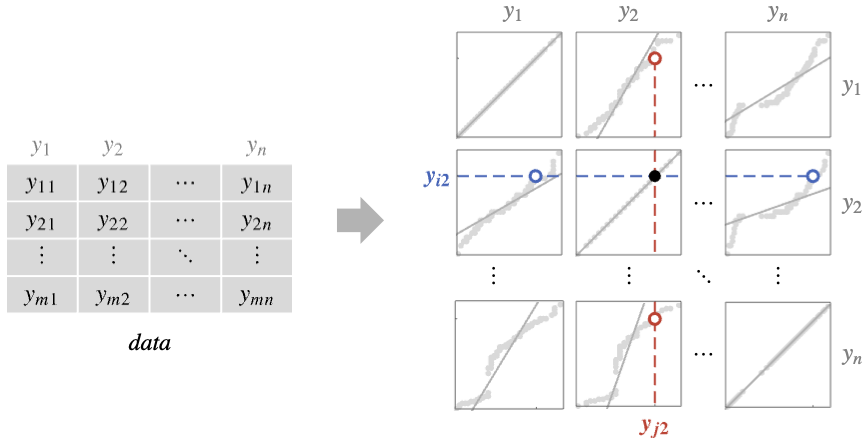
- It plots high-dimensional data by creating a grid of individual plots of just two data columns at a time.
- The plot compares column yi={y1i,y2i,…,ymi} against column yj={y1j,y2j,…,ymj} by plotting a quantile-quantile plot of yi against yj in panel {i,j}.
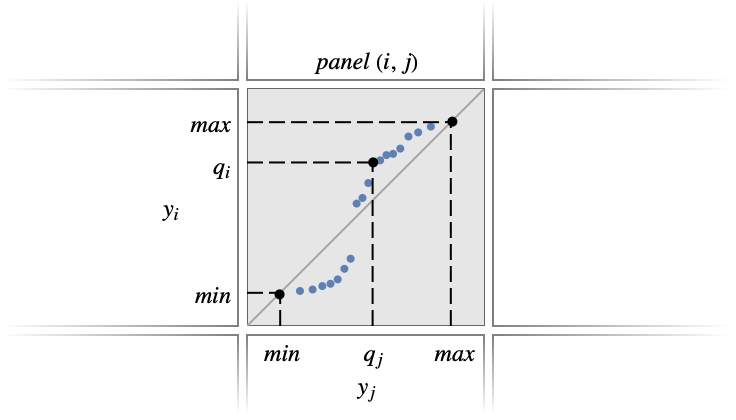
- The plot in panel
 consists of points whose coordinates are
  , where
  is the
") -smallest value in yj and
-smallest value in yj and  is the
") -smallest value in yi.
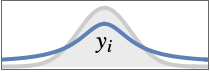
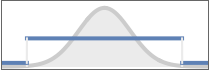
-smallest value in yi. - If the data in column yi has the same shape as column yj, the quantile plot will show a linear relation, even if there is a difference in location or scale:
-


yi is narrower than yj 
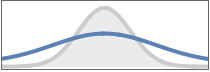
yi is wider than yj 
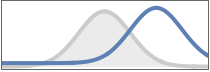
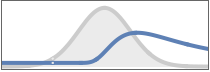
yi is shifted relative to yj - Skewed data, with more data in one tail than the other, shows slight curvature from the diagonal:
-

yi is skewed right relative to yj 

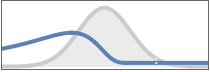
yi is skewed left relative to yj 
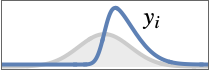
yi is skewed and shifted relative to yj - Heavy tails, indicating that yi has larger magnitude values than yj in the extremes, are indicated by plots that curve away from the diagonal at the ends:
-

yi has heavier tails than yj 
yi has a heavier right tail than yj 
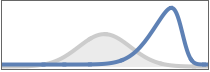
yi has a heavier left tail than yj - If the data has multiple modes or peaks in the density, there will be corresponding vertical transitions in the quantile plot where a range of quantiles have effectively the same value:
-

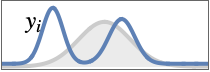
yi is bimodal 
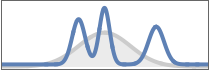
yi is multimodal 
yi is unformly distributed - PairwiseQuantilePlot[Tabular[…]cspec] extracts and plots values from the tabular object using the column specification cspec.
- The following forms of column specifications cspec are allowed for plotting tabular data:
-
{coly1,…,colyn} plot the colyi against colyj in a pairwise manner - PairwiseQuantilePlot takes the same options as QuantilePlot, with the following changes and additions: [List of all options]
-
AspectRatio 1 ratio of height to width for each panel Background None background to use for each plot Frame Automatic whether to draw frames around each panel FrameTicks Automatic whether to label frame edges with ticks and labels GridLines Automatic whether to include gridlines in panels GridLinesStyle Automatic style for gridlines HeaderAlignment Center horizontal and vertical alignments of headers HeaderBackground Automatic background colors to use for headers HeaderDisplayFunction Automatic function to use to format headers Headers Automatic labels to use for each data column yi HeaderStyle None styles to use for headers PerformanceGoal $PerformanceGoal aspects of performance to try to optimize PlotHighlighting Automatic highlighting effect for points PlotLayout Automatic how to arrange the panels PlotLegends Automatic legends for data PlotMarkers None markers to use to indicate each point PlotStyle Automatic graphics directives to determine styles of points PlotTheme $PlotTheme overall theme for the plot Spacings Automatic horizontal and vertical spacings - PlotLayout can have the following settings:
-

"Descending" data columns going down and to the right 
"Ascending" data columns going up and to the right 
"DescendingHalfMatrix" lower half of the descending layout 
"AscendingHalfMatrix" upper half of the ascending layout - Headers specifies the labels to use for each column in the data, and will generally be displayed above each column and after each row in the final plot.
- Possible settings include:
-
None leave the plot columns and rows unlabeled Automatic automatically label columns and rows All always include column and row labels "Indexed" number the columns and rows 1, 2, …, n {lbl1,lbl2,…,lbln} use the given labels lbli - HeaderAlignment determines how data column labels are aligned with regard to the plot columns and rows.
- HeaderAlignment can take the following forms:
-
Center center the labels in the header positions {h,v} separate horizontal and vertical alignments within the header position {cols,rows} use col for plot columns and row for plot rows - HeaderBackground and HeaderStyle can take the following forms:
-
None use ambient styling sty use the style sty for all headers {sty1,sty2,…,styn} use the given styles styi for successive headers {cols,rows} use col for plot columns and row for plot rows - HeaderDisplayFunction determines how headers are displayed.
- Possible settings are:
-
Automatic automatic formatting None use unprocessed labels - ColorData["DefaultPlotColors"] gives the default sequence of colors used by PlotStyle.
- The arguments to ColorFunction are yi1,yi2,…,yin. By default, the color function arguments are scaled per data column to be between 0 and 1.
- Use ColorFunctionScalingNone to use unscaled values, or ColorFunctionScaling{cfsc1,cfsc2,…} to selectively scale column values.
- Possible settings for PlotHighlighting include:
-
Automatic automatically highlight positions in the panels None disable interactive highlighting
List of all options
Examples
open all close allBasic Examples (3)
Create an array of Q-Q plots from data with labeled columns:
PairwiseQuantilePlot[IconizedObject[«crab data»]]Compare all columns in a dataset:
PairwiseQuantilePlot[IconizedObject[«iris data»]]Provide header names for the data:
PairwiseQuantilePlot[IconizedObject[«iris data»], Headers -> {"sepal length", "sepal width", "petal length", "petal width"}]Scope (3)
Data (2)
Take[IconizedObject[«medical data»], 5]PairwiseQuantilePlot[IconizedObject[«medical data»]]Take[IconizedObject[«iris data»], 5]PairwiseQuantilePlot[IconizedObject[«iris data»]]Tabular Data (1)
iris = ResourceData["Sample Tabular Data: Fisher Iris"]Create a pairwise array of quantile plots:
PairwiseQuantilePlot[iris -> {"SepalLength", "SepalWidth", "PetalLength", "PetalWidth"}]Use a different theme for the plot:
PairwiseQuantilePlot[iris -> {"SepalLength", "SepalWidth", "PetalLength", "PetalWidth"}, PlotTheme -> "Marketing"]Options (46)
AspectRatio (2)
By default, PairwiseQuantilePlot uses an equal height-to-width ratio:
PairwiseQuantilePlot[IconizedObject[«iris data»]]Use a fixed height-to-width ratio:
PairwiseQuantilePlot[IconizedObject[«iris data»], AspectRatio -> 1 / 2]Axes (3)
By default, Frame is used instead of Axes:
PairwiseQuantilePlot[IconizedObject[«iris data»]]Use AxesTrue to turn on axes:
PairwiseQuantilePlot[IconizedObject[«iris data»], Frame -> False, Axes -> True]Turn each axis on independently for all the subplots:
{PairwiseQuantilePlot[IconizedObject[«iris data»], Frame -> False, ImageSize -> Small, Axes -> {True, False}], PairwiseQuantilePlot[IconizedObject[«iris data»], Frame -> False, ImageSize -> Small, Axes -> {False, True}]}AxesStyle (3)
Change the style for the axes:
PairwiseQuantilePlot[IconizedObject[«iris data»], ImageSize -> Medium, Frame -> False, Axes -> True, AxesStyle -> Red]Specify the style of each axis:
PairwiseQuantilePlot[IconizedObject[«iris data»], ImageSize -> Medium, Frame -> False, Axes -> True, AxesStyle -> {Directive[Thick, Red], Directive[Thick, Blue]}]Use different styles for the ticks and the axes:
PairwiseQuantilePlot[IconizedObject[«iris data»], ImageSize -> Medium, Frame -> False, Axes -> True, AxesStyle -> Green, TicksStyle -> Magenta]Background (2)
By default, PairwiseQuantilePlot has a white background:
PairwiseQuantilePlot[IconizedObject[«iris data»]]PairwiseQuantilePlot[IconizedObject[«iris data»], Background -> GrayLevel[.9]]ColorFunction (3)
Color by scaled ![]() and
and ![]() coordinates:
coordinates:
Table[PairwiseQuantilePlot[IconizedObject[«iris data»], ImageSize -> Small, ColorFunction -> f, PlotLabel -> f[x, y]], {f, {Hue[#]&, Hue[#2]&}}]Color with a named color scheme:
PairwiseQuantilePlot[IconizedObject[«iris data»], ImageSize -> Medium, ColorFunction -> "DarkRainbow"]ColorFunction has higher priority than PlotStyle for coloring:
PairwiseQuantilePlot[IconizedObject[«iris data»], ImageSize -> Medium, ColorFunction -> "DarkRainbow", PlotStyle -> Directive[Red, Thick]]Frame (2)
FrameStyle (1)
GridLines (2)
By default, PairwiseQuantilePlot does not draw gridlines:
PairwiseQuantilePlot[IconizedObject[«iris data»]]PairwiseQuantilePlot[IconizedObject[«iris data»], GridLines -> Automatic, Background -> GrayLevel[.9]]HeaderBackground (2)
By default, PairwiseQuantilePlot uses a white header background:
PairwiseQuantilePlot[IconizedObject[«iris data»], Headers -> "Indexed"]Set a header background color:
PairwiseQuantilePlot[IconizedObject[«iris data»], Headers -> "Indexed", HeaderBackground -> LightGray]Headers (3)
By default, PairwiseQuantilePlot does not label columns:
PairwiseQuantilePlot[IconizedObject[«iris data»]]Number the columns for unlabeled data:
PairwiseQuantilePlot[IconizedObject[«iris data»], Headers -> "Indexed"]Provide header names for the columns:
PairwiseQuantilePlot[IconizedObject[«iris data»], Headers -> CharacterRange["a", "d"]]ImageSize (6)
Use named sizes such as Tiny, Small, Medium, and Large:
{PairwiseQuantilePlot[IconizedObject[«iris data»], ImageSize -> Tiny], PairwiseQuantilePlot[IconizedObject[«iris data»], ImageSize -> Medium]}Specify the width of the plot:
{PairwiseQuantilePlot[IconizedObject[«iris data»], ImageSize -> 200], PairwiseQuantilePlot[IconizedObject[«iris data»], AspectRatio -> 1.5, ImageSize -> 200]}Specify the height of the plot:
{PairwiseQuantilePlot[IconizedObject[«iris data»], ImageSize -> {Automatic, 200}], PairwiseQuantilePlot[IconizedObject[«iris data»], AspectRatio -> 1.5, ImageSize -> {Automatic, 200}]}Allow the width and height to be up to a certain size:
{PairwiseQuantilePlot[IconizedObject[«iris data»], ImageSize -> UpTo[250]], PairwiseQuantilePlot[IconizedObject[«iris data»], AspectRatio -> 1.5, ImageSize -> UpTo[250]]}Specify the width and height for a graphic, padding with space if necessary:
PairwiseQuantilePlot[IconizedObject[«iris data»], AspectRatio -> 1.5, Background -> LightBlue, ImageSize -> {250, 250}]Setting AspectRatioFull will fill the available space:
PairwiseQuantilePlot[IconizedObject[«iris data»], Background -> LightBlue, ImageSize -> {250, 250}, AspectRatio -> Full]Use maximum sizes for the width and height:
{PairwiseQuantilePlot[IconizedObject[«iris data»], Background -> LightBlue, ImageSize -> {UpTo[300], UpTo[200]}], PairwiseQuantilePlot[IconizedObject[«iris data»], AspectRatio -> 2, Background -> LightBlue, ImageSize -> {UpTo[300], UpTo[200]}]}Use ImageSizeFull to fill the available space in an object:
Framed[Pane[PairwiseQuantilePlot[IconizedObject[«iris data»], Background -> LightBlue, ImageSize -> Full], {200, 150}]]Joined (2)
PlotLabel (1)
PlotLayout (1)
PlotRange (3)
PlotRange is automatically calculated:
PairwiseQuantilePlot[IconizedObject[«iris groups»], ImageSize -> Medium]PairwiseQuantilePlot[IconizedObject[«iris groups»], ImageSize -> Medium, PlotRange -> All]Show the distribution for ![]() between 1 and 2 and
between 1 and 2 and ![]() between –1 and 3:
between –1 and 3:
PairwiseQuantilePlot[IconizedObject[«iris groups»], ImageSize -> Medium, PlotRange -> {{1, 2}, {-1, 3}}]PlotStyle (1)
Style the data using PlotStyle:
PairwiseQuantilePlot[IconizedObject[«Iris»], PlotStyle -> Directive[Red, PointSize[Small]]]PlotTheme (2)
Use a theme with simple ticks and gridlines in a bright color scheme:
PairwiseQuantilePlot[IconizedObject[«iris data»], ImageSize -> Medium, PlotTheme -> "Backdrop"]PairwiseQuantilePlot[IconizedObject[«iris data»], ImageSize -> Medium, PlotTheme -> "Business", PlotStyle -> StandardRed]ReferenceLineStyle (4)
ReferenceLineStyle by default uses a Dotted form of PlotStyle:
PairwiseQuantilePlot[IconizedObject[«iris data»], ImageSize -> Medium]Draw a dotted red reference line:
PairwiseQuantilePlot[IconizedObject[«iris data»], ImageSize -> Medium, ReferenceLineStyle -> Red]Draw a solid red reference line:
PairwiseQuantilePlot[IconizedObject[«iris data»], ImageSize -> Medium, ReferenceLineStyle -> Directive[Red, Dashing[0]]]Use None to turn off the reference line:
PairwiseQuantilePlot[IconizedObject[«iris data»], ImageSize -> Medium, ReferenceLineStyle -> None]ScalingFunctions (2)
Text
Wolfram Research (2024), PairwiseQuantilePlot, Wolfram Language function, https://reference.wolfram.com/language/ref/PairwiseQuantilePlot.html (updated 2025).
CMS
Wolfram Language. 2024. "PairwiseQuantilePlot." Wolfram Language & System Documentation Center. Wolfram Research. Last Modified 2025. https://reference.wolfram.com/language/ref/PairwiseQuantilePlot.html.
APA
Wolfram Language. (2024). PairwiseQuantilePlot. Wolfram Language & System Documentation Center. Retrieved from https://reference.wolfram.com/language/ref/PairwiseQuantilePlot.html