-
関連項目
- 関数
- AdjacencyMatrix
- WeightedAdjacencyGraph
- IncidenceGraph
- KirchhoffGraph
-
- 実体タイプ
- Graph
-
- インタープリタタイプ
- Graph
- 関連するガイド
-
-
関連項目
- 関数
- AdjacencyMatrix
- WeightedAdjacencyGraph
- IncidenceGraph
- KirchhoffGraph
-
- 実体タイプ
- Graph
-
- インタープリタタイプ
- Graph
- 関連するガイド
-
関連項目
AdjacencyGraph[amat]
隣接行列 amat のグラフを与える.
AdjacencyGraph[{v1,v2,…},amat]
頂点 vi,隣接行列 amat のグラフを与える.
AdjacencyGraph
AdjacencyGraph[amat]
隣接行列 amat のグラフを与える.
AdjacencyGraph[{v1,v2,…},amat]
頂点 vi,隣接行列 amat のグラフを与える.
詳細とオプション
- AdjacencyGraph[amat]はAdjacencyGraph[{1,2,…,n},amat]に等しい.ただし,amat の次元は
×
である. - AdjacencyGraphにはGraphと同じオプションが使える.
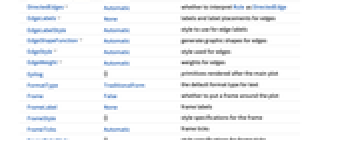
- オプションDirectedEdgesを使って有向グラフと無向グラフのどちらを構築するかが制御できる.
- AdjacencyGraphで使用可能なDirectedEdgesの設定値
-
Automatic amat が対称の場合に無向であるグラフ True 有向グラフを構築 False 無向グラフを構築
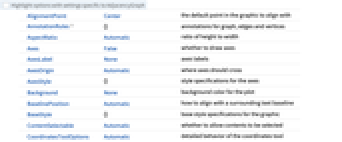
全オプションのリスト
予備知識
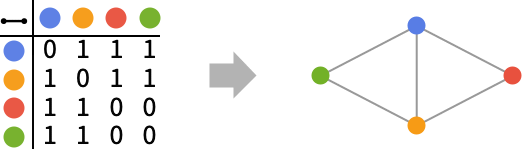
- AdjacencyGraphは,無向グラフあるいは有向グラフの隣接行列表現からグラフを作る.隣接行列は,行と列がそれぞれグラフの頂点に当たり,要素 aijが頂点 viから頂点 vjまでの(有向)辺の数を表す非負の整数である正方行列である.対角項がある隣接行列は,自己ループを作る.
- オプションDirectedEdges(可能な値はAutomatic.True,False)を使って有向グラフを作るか無向グラフを作るかを制御することができる.デフォルトで,AdjacencyGraphは,入力行列が対称行列の場合は無向グラフを,その他の場合は有向グラフを返す.
- AdjacencyGraphはGraphと同じオプション(EdgeStyle,VertexStyle,EdgeLabels,VertexLabels,GraphLayout,VertexCoordinates等)を取る.AdjacencyGraphはグラフの重みは考慮しないので,重み付きの隣接行列からグラフを構築する場合はWeightedAdjacencyGraphを使わなければならない.
- AdjacencyListは,指定された頂点 viに隣接する頂点のリスト,つまり隣接行列の i 番目の列(無向グラフの場合は i 番目の行)中の非零要素の位置のリストに相当するリストを返す.任意のグラフ(AdjacencyGraphによって構築されたグラフを含む)の隣接行列全体はAdjacencyMatrixで得ることができる.IncidenceGraphは,グラフの構築に,隣接行列の代りに指標行列表現を使う.
例題
すべて開く すべて閉じる例 (2)
スコープ (7)
AdjacencyGraph[(| | | | |
| - | - | - | - |
| 0 | 1 | 1 | 0 |
| 1 | 0 | 1 | 1 |
| 1 | 1 | 0 | 1 |
| 0 | 1 | 1 | 0 |)]AdjacencyGraph[(| | | | |
| - | - | - | - |
| 0 | 1 | 0 | 0 |
| 1 | 0 | 0 | 0 |
| 1 | 1 | 0 | 0 |
| 1 | 1 | 0 | 0 |)]DirectedEdgesを使って対称行列から有向グラフを構築する:
AdjacencyGraph[(| | | | |
| - | - | - | - |
| 0 | 1 | 1 | 0 |
| 1 | 0 | 1 | 1 |
| 1 | 1 | 0 | 1 |
| 0 | 1 | 1 | 0 |), DirectedEdges -> True]{AdjacencyGraph[(| | | | |
| - | - | - | - |
| 1 | 1 | 1 | 0 |
| 1 | 0 | 1 | 1 |
| 1 | 1 | 0 | 1 |
| 0 | 1 | 1 | 0 |)], AdjacencyGraph[(| | | | |
| - | - | - | - |
| 0 | 1 | 0 | 0 |
| 1 | 0 | 0 | 0 |
| 1 | 1 | 1 | 0 |
| 1 | 1 | 0 | 0 |)]}SparseArrayオブジェクトを使って隣接行列を指定する:
AdjacencyGraph[SparseArray[{{i_, j_} /; 0 < Abs[i - j] ≤ 3 -> 1}, {6, 6}]]VertexList@AdjacencyGraph[(| | | | |
| - | - | - | - |
| 1 | 1 | 1 | 0 |
| 1 | 0 | 1 | 1 |
| 1 | 1 | 0 | 1 |
| 0 | 1 | 1 | 0 |)]VertexList@AdjacencyGraph[{a, b, c, d}, (| | | | |
| - | - | - | - |
| 1 | 1 | 1 | 0 |
| 1 | 0 | 1 | 1 |
| 1 | 1 | 0 | 1 |
| 0 | 1 | 1 | 0 |)]AdjacencyGraphは大きい行列にも使える:
SparseArray[{Band[{2, 1}] -> 1, Band[{3, 1}] -> 1}, {10^6, 10^6}]Timing[AdjacencyGraph[%]//EdgeCount]オプション (83)
AnnotationRules (3)
AdjacencyGraph[(| | | |
| - | - | - |
| 0 | 1 | 1 |
| 1 | 0 | 1 |
| 1 | 1 | 0 |), AnnotationRules -> {3 -> {VertexLabels -> "hello"}}]AdjacencyGraph[(| | | |
| - | - | - |
| 0 | 1 | 1 |
| 1 | 0 | 1 |
| 1 | 1 | 0 |), AnnotationRules -> {12 -> {EdgeLabels -> "hello"}}]AdjacencyGraph[(| | | |
| - | - | - |
| 0 | 1 | 1 |
| 1 | 0 | 1 |
| 1 | 1 | 0 |), AnnotationRules -> {"GraphProperties" -> {"Message" -> "hello"}}]AnnotationValue[%, "Message"]DirectedEdges (3)
AdjacencyGraph[(| | | | | |
| - | - | - | - | - |
| 0 | 1 | 1 | 1 | 1 |
| 1 | 0 | 1 | 1 | 1 |
| 1 | 1 | 0 | 1 | 1 |
| 1 | 1 | 1 | 0 | 1 |
| 1 | 1 | 1 | 1 | 0 |)]DirectedEdges->Trueを使って有向グラフを生成する:
AdjacencyGraph[(| | | | | |
| - | - | - | - | - |
| 0 | 1 | 1 | 1 | 1 |
| 1 | 0 | 1 | 1 | 1 |
| 1 | 1 | 0 | 1 | 1 |
| 1 | 1 | 1 | 0 | 1 |
| 1 | 1 | 1 | 1 | 0 |), DirectedEdges -> True, EdgeStyle -> Arrowheads[Medium]]AdjacencyGraph[(| | | | | |
| - | - | - | - | - |
| 0 | 1 | 1 | 1 | 1 |
| 0 | 0 | 0 | 0 | 0 |
| 0 | 0 | 0 | 0 | 0 |
| 0 | 0 | 0 | 0 | 0 |
| 0 | 0 | 0 | 0 | 0 |)]EdgeLabels (7)
AdjacencyGraph[(| | | |
| - | - | - |
| 0 | 1 | 1 |
| 1 | 0 | 1 |
| 1 | 1 | 0 |), EdgeLabels -> {12 -> "Hello"}]el = {12, 13, 23};AdjacencyGraph[(| | | |
| - | - | - |
| 0 | 1 | 1 |
| 1 | 0 | 1 |
| 1 | 1 | 0 |), EdgeLabels -> Table[el[[i]] -> Subscript["e", i], {i, Length[el]}]]AdjacencyGraph[(| | | |
| - | - | - |
| 0 | 1 | 1 |
| 1 | 0 | 1 |
| 1 | 1 | 0 |), EdgeLabels -> {12 -> [image], 23 -> [image], 13 -> [image]}]Placedを記号位置と共に使って辺に沿ったラベルの置き方を制御する:
Table[AdjacencyGraph[(| | | |
| - | - | - |
| 0 | 1 | 1 |
| 1 | 0 | 1 |
| 1 | 1 | 0 |), EdgeLabels -> {12 -> Placed["■■■", p]}, PlotLabel -> p], {p, {"Start", "Middle", "End"}}]Table[AdjacencyGraph[(| | | |
| - | - | - |
| 0 | 1 | 1 |
| 1 | 0 | 1 |
| 1 | 1 | 0 |), EdgeLabels -> {12 -> Placed["■■■", p]}, PlotLabel -> p, BaselinePosition -> Bottom], {p, {0, 1 / 4, 1 / 3}}]Table[AdjacencyGraph[(| | | |
| - | - | - |
| 0 | 1 | 1 |
| 1 | 0 | 1 |
| 1 | 1 | 0 |), EdgeLabels -> {12 -> Placed["■■■", {1 / 2, p}]}, PlotLabel -> p, BaselinePosition -> Bottom], {p, {{0, 0}, {1 / 2, 1 / 2}, {1, 1}}}]AdjacencyGraph[(| | | |
| - | - | - |
| 0 | 1 | 1 |
| 1 | 0 | 1 |
| 1 | 1 | 0 |), EdgeLabels -> {31 -> Placed[{"lbl1", "lbl2"}, {"Start", "End"}]}]AdjacencyGraph[(| | | |
| - | - | - |
| 0 | 1 | 1 |
| 1 | 0 | 1 |
| 1 | 1 | 0 |), EdgeLabels -> {31 -> Placed[{"lbl1", "lbl2", "lbl3"}, {"Start", "Middle", "End"}]}]TooltipとStatusAreaの値を使って自動的にラベルを付ける:
AdjacencyGraph[(| | | |
| - | - | - |
| 0 | 1 | 1 |
| 1 | 0 | 1 |
| 1 | 1 | 0 |), EdgeLabels -> Placed["Name", Tooltip]]AdjacencyGraph[(| | | |
| - | - | - |
| 0 | 1 | 1 |
| 1 | 0 | 1 |
| 1 | 1 | 0 |), EdgeLabels -> Placed["Name", StatusArea]]EdgeShapeFunction (6)
EdgeShapeFunctionの組込み設定のリストを得る:
ResourceData["EdgeShapeFunction"]AdjacencyGraph[(| | | |
| - | - | - |
| 0 | 1 | 1 |
| 1 | 0 | 1 |
| 1 | 1 | 0 |), EdgeShapeFunction -> "Line"]Table[AdjacencyGraph[(| | | |
| - | - | - |
| 0 | 1 | 1 |
| 1 | 0 | 1 |
| 1 | 1 | 0 |), EdgeShapeFunction -> {{ef, "ArrowSize" -> 0.1}}, PlotLabel -> ef], {ef, {"BoxLine", "DiamondLine", "DotLine"}}]Table[AdjacencyGraph[(| | | |
| - | - | - |
| 0 | 1 | 0 |
| 0 | 0 | 1 |
| 1 | 0 | 0 |), EdgeShapeFunction -> {{ef, "ArrowSize" -> 0.1}}, PlotLabel -> ef], {ef, ResourceData["EdgeShapeFunction", "FilledArrow"]}]Table[AdjacencyGraph[(| | | |
| - | - | - |
| 0 | 1 | 0 |
| 0 | 0 | 1 |
| 1 | 0 | 0 |), EdgeShapeFunction -> {{ef, "ArrowSize" -> 0.1}}, PlotLabel -> ef], {ef, ResourceData["EdgeShapeFunction", "UnfilledArrow"]}]Table[AdjacencyGraph[(| | | |
| - | - | - |
| 0 | 1 | 0 |
| 0 | 0 | 1 |
| 1 | 0 | 0 |), EdgeShapeFunction -> {{ef, "ArrowSize" -> 0.1}}, PlotLabel -> ef], {ef, ResourceData["EdgeShapeFunction", "CarvedArrow"]}]AdjacencyGraph[(| | | |
| - | - | - |
| 0 | 1 | 0 |
| 0 | 0 | 1 |
| 1 | 0 | 0 |), EdgeShapeFunction -> {12 -> "FilledArcArrow"}]AdjacencyGraph[(| | | |
| - | - | - |
| 0 | 1 | 0 |
| 0 | 0 | 1 |
| 1 | 0 | 0 |), EdgeShapeFunction -> {12 -> "FilledArcArrow", "CarvedArrow"}]ef[pts_List, e_] :=
Block[{s = 0.015, g = [image]}, {Arrowheads[{{s, 0.33, g}, {s, 0.67, g}}], Arrow[pts]}]AdjacencyGraph[(| | | |
| - | - | - |
| 0 | 1 | 1 |
| 1 | 0 | 1 |
| 1 | 1 | 0 |), EdgeShapeFunction -> ef]EdgeShapeFunctionはEdgeStyleと組み合せることができる:
AdjacencyGraph[(| | | |
| - | - | - |
| 0 | 1 | 1 |
| 1 | 0 | 1 |
| 1 | 1 | 0 |), EdgeStyle -> Blue, EdgeShapeFunction -> (Line[#1]&)]EdgeShapeFunctionはEdgeStyleより優先順位が高い:
AdjacencyGraph[(| | | |
| - | - | - |
| 0 | 1 | 1 |
| 1 | 0 | 1 |
| 1 | 1 | 0 |), EdgeStyle -> Blue, EdgeShapeFunction -> ({Red, Line[#1]}&)]EdgeStyle (2)
Table[AdjacencyGraph[(| | | |
| - | - | - |
| 0 | 1 | 1 |
| 1 | 0 | 1 |
| 1 | 1 | 0 |), EdgeStyle -> style, PlotLabel -> style], {style, {Gray, Dashed, Thick}}]AdjacencyGraph[(| | | |
| - | - | - |
| 0 | 1 | 1 |
| 1 | 0 | 1 |
| 1 | 1 | 0 |), EdgeStyle -> {12 -> Blue, 13 -> Dashed}]EdgeWeight (2)
AdjacencyGraph[(| | | |
| - | - | - |
| 0 | 1 | 1 |
| 1 | 0 | 1 |
| 1 | 1 | 0 |), EdgeWeight -> RandomInteger[5, 3]]WeightedAdjacencyMatrix[%]//MatrixFormAdjacencyGraph[(| | | |
| - | - | - |
| 0 | 1 | 1 |
| 1 | 0 | 1 |
| 1 | 1 | 0 |), EdgeWeight -> {a, b, c}]WeightedAdjacencyMatrix[%]//MatrixFormGraphHighlight (3)
AdjacencyGraph[(| | | |
| - | - | - |
| 0 | 1 | 1 |
| 1 | 0 | 1 |
| 1 | 1 | 0 |), VertexSize -> Tiny, GraphHighlight -> {1}]AdjacencyGraph[(| | | |
| - | - | - |
| 0 | 1 | 1 |
| 1 | 0 | 1 |
| 1 | 1 | 0 |), VertexSize -> Tiny, GraphHighlight -> {23}]AdjacencyGraph[(| | | |
| - | - | - |
| 0 | 1 | 1 |
| 1 | 0 | 1 |
| 1 | 1 | 0 |), VertexSize -> Tiny, GraphHighlight -> {1, 2, 23}]GraphHighlightStyle (2)
GraphHighlightStyleの組込み設定のリストを得る:
ResourceData["GraphHighlightStyle"]GraphHighlightStyleの組込み設定を使う:
AdjacencyGraph[(| | | |
| - | - | - |
| 0 | 1 | 1 |
| 1 | 0 | 1 |
| 1 | 1 | 0 |), GraphHighlight -> {1, 23}, VertexSize -> Small, GraphHighlightStyle -> #, PlotLabel -> #]& /@ Select[ResourceData["GraphHighlightStyle"], # =!= Automatic&]GraphLayout (5)
AdjacencyGraph[(| | | |
| - | - | - |
| 0 | 1 | 1 |
| 1 | 0 | 1 |
| 1 | 1 | 0 |), GraphLayout -> Automatic]m = AdjacencyMatrix[GridGraph[{10, 10}]];Table[AdjacencyGraph[m, GraphLayout -> l, PlotLabel -> l], {l, {"CircularEmbedding", "SpiralEmbedding"}}]m = AdjacencyMatrix[GridGraph[{10, 10}]];Table[AdjacencyGraph[m, GraphLayout -> l, PlotLabel -> l], {l, {"SpringEmbedding", "SpringElectricalEmbedding", "HighDimensionalEmbedding"}}]VertexCoordinatesはGraphLayoutの座標を無効にする:
{AdjacencyGraph[(| | | |
| - | - | - |
| 0 | 1 | 1 |
| 1 | 0 | 1 |
| 1 | 1 | 0 |), GraphLayout -> "SpringElectricalEmbedding"],
AdjacencyGraph[(| | | |
| - | - | - |
| 0 | 1 | 1 |
| 1 | 0 | 1 |
| 1 | 1 | 0 |), GraphLayout -> "SpringElectricalEmbedding", VertexCoordinates -> Table[{i, i}, {i, 0, 2}]]}AbsoluteOptionsを使い,レイアウトアルゴリズムで計算されたVertexCoordinatesを抽出する:
AdjacencyGraph[(| | | |
| - | - | - |
| 0 | 1 | 1 |
| 1 | 0 | 1 |
| 1 | 1 | 0 |)]AbsoluteOptions[%, VertexCoordinates]PlotTheme (4)
基本テーマ (2)
特徴テーマ (2)
VertexCoordinates (3)
AdjacencyGraph[(| | | |
| - | - | - |
| 0 | 1 | 1 |
| 1 | 0 | 1 |
| 1 | 1 | 0 |)]AbsoluteOptionsを使って結果の頂点座標を抽出する:
AbsoluteOptions[%, VertexCoordinates]ellipseLayout[n_, {a_, b_}] := Table[{a Cos[2Pi / n u], b Sin[2Pi / n u]}, {u, 1, n}]Graphics[Point[ellipseLayout[20, {2, 1}]]]m = AdjacencyMatrix[PathGraph[Range[20]]];AdjacencyGraph[m, VertexCoordinates -> ellipseLayout[20, {2, 1}]]VertexCoordinatesはGraphLayoutより優先順位が高い:
AdjacencyGraph[(| | | |
| - | - | - |
| 0 | 1 | 1 |
| 1 | 0 | 1 |
| 1 | 1 | 0 |), VertexCoordinates -> Table[{i, i}, {i, 3}], GraphLayout -> "CircularEmbedding"]VertexLabels (13)
AdjacencyGraph[(| | | |
| - | - | - |
| 0 | 1 | 1 |
| 1 | 0 | 1 |
| 1 | 1 | 0 |), VertexLabels -> "Name"]AdjacencyGraph[(| | | |
| - | - | - |
| 0 | 1 | 1 |
| 1 | 0 | 1 |
| 1 | 1 | 0 |), VertexLabels -> {1 -> "one"}]AdjacencyGraph[(| | | |
| - | - | - |
| 0 | 1 | 1 |
| 1 | 0 | 1 |
| 1 | 1 | 0 |), VertexLabels -> Table[i -> Subscript[v, i], {i, 3}]]AdjacencyGraph[(| | | |
| - | - | - |
| 0 | 1 | 1 |
| 1 | 0 | 1 |
| 1 | 1 | 0 |), VertexLabels -> {1 -> [image], 2 -> [image], 3 -> [image]}, ImagePadding -> 30]Placedを記号位置と共に使って位置の外側を含むラベルの置き方を制御する:
Table[AdjacencyGraph[(| | | |
| - | - | - |
| 0 | 1 | 1 |
| 1 | 0 | 1 |
| 1 | 1 | 0 |), VertexSize -> 0.1, VertexShapeFunction -> "Square", VertexLabels -> Table[i -> Placed["■■■", p], {i, 3}], PlotLabel -> p, ImagePadding -> 20], {p, {Before, After, Below, Above}}]pl = {{Before, Below}, {After, Below}, {Before, Above}, {After, Above}};Table[AdjacencyGraph[(| | | |
| - | - | - |
| 0 | 1 | 1 |
| 1 | 0 | 1 |
| 1 | 1 | 0 |), VertexSize -> 0.1, VertexShapeFunction -> "Square", ImagePadding -> 20, VertexLabels -> Table[i -> Placed["■■■", p], {i, 3}], PlotLabel -> p], {p, pl}]Table[AdjacencyGraph[(| | | |
| - | - | - |
| 0 | 1 | 1 |
| 1 | 0 | 1 |
| 1 | 1 | 0 |), VertexSize -> 0.25, VertexLabels -> Table[i -> Placed["■■■", p], {i, 3}], VertexShapeFunction -> "Square", PlotLabel -> p], {p, {Left, Top, Right, Bottom}}]pl = {{Left, Bottom}, {Right, Bottom}, {Left, Top}, {Right, Top}};Table[AdjacencyGraph[(| | | |
| - | - | - |
| 0 | 1 | 1 |
| 1 | 0 | 1 |
| 1 | 1 | 0 |), VertexSize -> 0.25, VertexShapeFunction -> "Square", VertexLabels -> Table[i -> Placed["■■■", p], {i, 3}], PlotLabel -> p], {p, pl}]Table[AdjacencyGraph[(| | | |
| - | - | - |
| 0 | 1 | 1 |
| 1 | 0 | 1 |
| 1 | 1 | 0 |), VertexSize -> 0.25, VertexShapeFunction -> "Square", VertexLabels -> Table[i -> Placed[[image], p], {i, 3}], PlotLabel -> p, BaselinePosition -> Bottom], {p, {{0, 0}, {1 / 2, 1 / 2}, {1, 1}}}]すべてのラベルを頂点の右上のコーナーに置き,ラベル内の座標位置を変える:
Table[AdjacencyGraph[(| | | |
| - | - | - |
| 0 | 1 | 1 |
| 1 | 0 | 1 |
| 1 | 1 | 0 |), VertexSize -> 0.35, VertexShapeFunction -> "Square", VertexLabels -> Table[i -> Placed[[image], {{1, 1}, p}], {i, 3}], PlotLabel -> p, BaselinePosition -> Bottom], {p, {{0, 0}, {1 / 2, 1 / 2}, {1, 1}}}]AdjacencyGraph[(| | | |
| - | - | - |
| 0 | 1 | 1 |
| 1 | 0 | 1 |
| 1 | 1 | 0 |), VertexLabels -> {3 -> Placed[{"lbl1", "lbl2"}, {Above, Below}]}]AdjacencyGraph[(| | | |
| - | - | - |
| 0 | 1 | 1 |
| 1 | 0 | 1 |
| 1 | 1 | 0 |), VertexLabels -> {3 -> Placed[{"lbl1", "lbl2", "lbl3", "lbl4"}, {Above, After, Below, Before}]}]Placedの引数を使ってTooltipを含むフォーマットを制御する:
AdjacencyGraph[(| | | |
| - | - | - |
| 0 | 1 | 1 |
| 1 | 0 | 1 |
| 1 | 1 | 0 |), VertexLabels -> Placed["Name", Tooltip]]あるいはStatusAreaを含むフォーマットを制御する:
AdjacencyGraph[(| | | |
| - | - | - |
| 0 | 1 | 1 |
| 1 | 0 | 1 |
| 1 | 1 | 0 |), VertexLabels -> Placed["Name", StatusArea]]rotateLabel[lab_] := Rotate[lab, 45Degree]AdjacencyGraph[(| | | |
| - | - | - |
| 0 | 1 | 1 |
| 1 | 0 | 1 |
| 1 | 1 | 0 |), VertexLabels -> Table[i -> Placed["xxx", Below, rotateLabel], {i, 3}]]panelLabel[lab_] := Panel[lab, FrameMargins -> 0, Background -> Lighter[Blue, 0.7]]AdjacencyGraph[(| | | |
| - | - | - |
| 0 | 1 | 1 |
| 1 | 0 | 1 |
| 1 | 1 | 0 |), VertexLabels -> Table[i -> Placed["xxx", Center, panelLabel], {i, 3}]]hyperlinkLabel[lab_] := Hyperlink[lab, "http://www.wolfram.com"]AdjacencyGraph[(| | | |
| - | - | - |
| 0 | 1 | 1 |
| 1 | 0 | 1 |
| 1 | 1 | 0 |), VertexLabels -> Table[i -> Placed["xxx", Center, hyperlinkLabel], {i, 3}]]VertexShape (5)
任意のGraphics,Image,あるいはGraphics3Dを頂点の形として使う:
Table[AdjacencyGraph[(| | | |
| - | - | - |
| 0 | 1 | 1 |
| 1 | 0 | 1 |
| 1 | 1 | 0 |), VertexShape -> s, VertexSize -> Medium], {s, {[image], [image], [image]}}]AdjacencyGraph[(| | | |
| - | - | - |
| 0 | 1 | 1 |
| 1 | 0 | 1 |
| 1 | 1 | 0 |), VertexShape -> {2 -> [image]}, VertexSize -> Small]VertexShapeはVertexSizeと組み合せることができる:
Table[AdjacencyGraph[(| | | |
| - | - | - |
| 0 | 1 | 1 |
| 1 | 0 | 1 |
| 1 | 1 | 0 |), VertexSize -> s, VertexShape -> [image], PlotLabel -> s], {s, {Small, Large}}]VertexShapeはVertexStyleの影響を受けない:
AdjacencyGraph[(| | | |
| - | - | - |
| 0 | 1 | 1 |
| 1 | 0 | 1 |
| 1 | 1 | 0 |), VertexSize -> 0.2, VertexShape -> [image], VertexStyle -> Blue]VertexShapeFunctionはVertexShapeより優先順位が高い:
AdjacencyGraph[(| | | |
| - | - | - |
| 0 | 1 | 1 |
| 1 | 0 | 1 |
| 1 | 1 | 0 |), VertexSize -> 0.2, VertexShapeFunction -> "Square", VertexShape -> [image]]VertexShapeFunction (10)
VertexShapeFunctionの組込みコレクションのリストを得る:
ResourceData["VertexShapeFunction"]"Basic"コレクションのVertexShapeFunctionの組込み設定を使う:
ResourceData["VertexShapeFunction", "Basic"]Table[AdjacencyGraph[(| | | |
| - | - | - |
| 0 | 1 | 1 |
| 1 | 0 | 1 |
| 1 | 1 | 0 |), VertexShapeFunction -> vf, VertexSize -> 0.2, PlotLabel -> vf], {vf, {"Triangle", "Square", "Rectangle", "Pentagon", "Hexagon", "Octagon"}}]Table[AdjacencyGraph[(| | | |
| - | - | - |
| 0 | 1 | 1 |
| 1 | 0 | 1 |
| 1 | 1 | 0 |), VertexShapeFunction -> vf, VertexSize -> 0.2, PlotLabel -> vf], {vf, {"DownTrapezoid", "UpTrapezoid", "Parallelogram", "FiveDown", "Circle", "Diamond", "Star", "Capsule"}}]"Rounded"コレクションのVertexShapeFunctionの組込み設定を使う:
ResourceData["VertexShapeFunction", "Rounded"]Table[AdjacencyGraph[(| | | |
| - | - | - |
| 0 | 1 | 1 |
| 1 | 0 | 1 |
| 1 | 1 | 0 |), VertexShapeFunction -> vf, VertexSize -> 0.2, PlotLabel -> vf], {vf, ResourceData["VertexShapeFunction", "Rounded"]}]"Concave"コレクションのVertexShapeFunctionの組込み設定を使う:
ResourceData["VertexShapeFunction", "Concave"]Table[AdjacencyGraph[(| | | |
| - | - | - |
| 0 | 1 | 1 |
| 1 | 0 | 1 |
| 1 | 1 | 0 |), VertexShapeFunction -> vf, VertexSize -> 0.2, PlotLabel -> vf], {vf, ResourceData["VertexShapeFunction", "Concave"]}]AdjacencyGraph[(| | | |
| - | - | - |
| 0 | 1 | 1 |
| 1 | 0 | 1 |
| 1 | 1 | 0 |), VertexShapeFunction -> { 1 -> "Square"}, VertexSize -> 0.2]AdjacencyGraph[(| | | |
| - | - | - |
| 0 | 1 | 1 |
| 1 | 0 | 1 |
| 1 | 1 | 0 |), VertexShapeFunction -> { 1 -> "Square", "Triangle"}, VertexSize -> 0.2]AdjacencyGraph[(| | | |
| - | - | - |
| 0 | 1 | 1 |
| 1 | 0 | 1 |
| 1 | 1 | 0 |), VertexShapeFunction -> (Inset[[image], #]&)]vf[{xc_, yc_}, name_, {w_, h_}] :=
Block[{xmin = xc - w, xmax = xc + w, ymin = yc - h, ymax = yc + h},
Polygon[{{xmin, ymin}, {xmax, ymax}, {xmin, ymax}, {xmax, ymin}}]
];AdjacencyGraph[(| | | |
| - | - | - |
| 0 | 1 | 1 |
| 1 | 0 | 1 |
| 1 | 1 | 0 |), VertexShapeFunction -> vf, VertexSize -> 0.2]VertexShapeFunctionはVertexStyleと組み合せることができる:
vf1[{xc_, yc_}, name_, {w_, h_}] := Rectangle[{xc - w, yc - h}, {xc + w, yc + h}]AdjacencyGraph[(| | | |
| - | - | - |
| 0 | 1 | 1 |
| 1 | 0 | 1 |
| 1 | 1 | 0 |), VertexSize -> 0.2, VertexStyle -> Blue, VertexShapeFunction -> vf1]VertexShapeFunctionはVertexStyleより優先順位が高い:
vf2[{xc_, yc_}, name_, {w_, h_}] := {Red, Rectangle[{xc - w, yc - h}, {xc + w, yc + h}]}AdjacencyGraph[(| | | |
| - | - | - |
| 0 | 1 | 1 |
| 1 | 0 | 1 |
| 1 | 1 | 0 |), VertexSize -> 0.2, VertexStyle -> Blue, VertexShapeFunction -> vf2]VertexShapeFunctionはVertexSizeと組み合せることができる:
AdjacencyGraph[(| | | |
| - | - | - |
| 0 | 1 | 1 |
| 1 | 0 | 1 |
| 1 | 1 | 0 |), VertexShapeFunction -> "Star", VertexSize -> {1 -> Small, Medium}]VertexShapeFunctionはVertexShapeより優先順位が高い:
AdjacencyGraph[(| | | |
| - | - | - |
| 0 | 1 | 1 |
| 1 | 0 | 1 |
| 1 | 1 | 0 |), VertexSize -> 0.3, VertexShapeFunction -> "Star", VertexShape -> [image]]VertexSize (8)
AdjacencyGraph[(| | | |
| - | - | - |
| 0 | 1 | 1 |
| 1 | 0 | 1 |
| 1 | 1 | 0 |), VertexSize -> Automatic]Table[AdjacencyGraph[(| | | |
| - | - | - |
| 0 | 1 | 1 |
| 1 | 0 | 1 |
| 1 | 1 | 0 |), VertexSize -> s, PlotLabel -> s], {s, {Tiny, Small, Medium, Large}}]Table[AdjacencyGraph[(| | | |
| - | - | - |
| 0 | 1 | 1 |
| 1 | 0 | 1 |
| 1 | 1 | 0 |), VertexSize -> s, PlotLabel -> s], {s, 0.1, 1, 0.3}]Table[AdjacencyGraph[(| | | |
| - | - | - |
| 0 | 1 | 1 |
| 1 | 0 | 1 |
| 1 | 1 | 0 |), VertexSize -> {"Scaled", s}, PlotLabel -> {"Scaled", s}], {s, 0.1, 1, 0.3}]Table[AdjacencyGraph[(| | | |
| - | - | - |
| 0 | 1 | 1 |
| 1 | 0 | 1 |
| 1 | 1 | 0 |), VertexSize -> s, PlotLabel -> s], {s, {{0.1, 0.2}, {0.2, 0.1}}}]AdjacencyGraph[(| | | |
| - | - | - |
| 0 | 1 | 1 |
| 1 | 0 | 1 |
| 1 | 1 | 0 |), VertexSize -> {1 -> 0.2, 2 -> 0.3}]VertexSizeはVertexShapeFunctionと組み合せることができる:
Table[AdjacencyGraph[(| | | |
| - | - | - |
| 0 | 1 | 1 |
| 1 | 0 | 1 |
| 1 | 1 | 0 |), VertexSize -> s, VertexShapeFunction -> "Square", PlotLabel -> s], {s, {0.05, 0.1, 0.2}}]VertexSizeはVertexShapeと組み合せることができる:
Table[AdjacencyGraph[(| | | |
| - | - | - |
| 0 | 1 | 1 |
| 1 | 0 | 1 |
| 1 | 1 | 0 |), VertexSize -> s, VertexShape -> [image], PlotLabel -> s], {s, {0.1, 0.2, 0.4}}]VertexStyle (5)
Table[AdjacencyGraph[(| | | |
| - | - | - |
| 0 | 1 | 1 |
| 1 | 0 | 1 |
| 1 | 1 | 0 |), VertexStyle -> style, VertexSize -> 0.3, PlotLabel -> style], {style, {Yellow, EdgeForm[Dashed]}}]AdjacencyGraph[(| | | |
| - | - | - |
| 0 | 1 | 1 |
| 1 | 0 | 1 |
| 1 | 1 | 0 |), VertexStyle -> {1 -> Blue, 2 -> Red}, VertexSize -> 0.2]VertexShapeFunctionはVertexStyleと組み合せることができる:
vf1[{xc_, yc_}, name_, {w_, h_}] := Rectangle[{xc - w, yc - h}, {xc + w, yc + h}]AdjacencyGraph[(| | | |
| - | - | - |
| 0 | 1 | 1 |
| 1 | 0 | 1 |
| 1 | 1 | 0 |), VertexSize -> 0.2, VertexStyle -> Blue, VertexShapeFunction -> vf1]VertexShapeFunctionはVertexStyleより優先順位が高い:
vf2[{xc_, yc_}, name_, {w_, h_}] := {Red, Rectangle[{xc - w, yc - h}, {xc + w, yc + h}]}AdjacencyGraph[(| | | |
| - | - | - |
| 0 | 1 | 1 |
| 1 | 0 | 1 |
| 1 | 1 | 0 |), VertexSize -> 0.2, VertexStyle -> Blue, VertexShapeFunction -> vf2]VertexStyleはBaseStyleと組み合せることができる:
AdjacencyGraph[(| | | |
| - | - | - |
| 0 | 1 | 1 |
| 1 | 0 | 1 |
| 1 | 1 | 0 |), VertexStyle -> LightBlue, BaseStyle -> EdgeForm[Dotted], VertexSize -> 0.2]VertexStyleはBaseStyleより優先順位が高い:
AdjacencyGraph[(| | | |
| - | - | - |
| 0 | 1 | 1 |
| 1 | 0 | 1 |
| 1 | 1 | 0 |), VertexStyle -> LightBlue, BaseStyle -> Gray, VertexSize -> 0.2]VertexShapeはVertexStyleの影響を受けない:
AdjacencyGraph[(| | | |
| - | - | - |
| 0 | 1 | 1 |
| 1 | 0 | 1 |
| 1 | 1 | 0 |), VertexSize -> 0.2, VertexShape -> [image], VertexStyle -> Blue]VertexWeight (2)
AdjacencyGraph[(| | | |
| - | - | - |
| 0 | 1 | 1 |
| 1 | 0 | 1 |
| 1 | 1 | 0 |), VertexWeight -> {2, 3, 4}]AnnotationValue[{%, 1}, VertexWeight]AdjacencyGraph[(| | | |
| - | - | - |
| 0 | 1 | 1 |
| 1 | 0 | 1 |
| 1 | 1 | 0 |), VertexWeight -> {a, b, c}]AnnotationValue[{%, 1}, VertexWeight]アプリケーション (2)
s〚i〛⊆s〚j〛であれば頂点 i がs〚i〛を表し辺 ij を持つ集合 s のリストからグラフを構築する:
s = Subsets[{1, 2, 3}]AdjacencyGraph[s, Table[Boole@SubsetQ[s[[i]], s[[j]]], {i, Length[s]}, {j, Length[s]}], VertexLabels -> "Name"]s〚i〛がs〚j〛を分割する (s〚i〛∣s〚j〛)場合に ij となる整数 s のリストからグラフを構築する:
s = Divisors[24]AdjacencyGraph[s, Table[Boole@Divisible[s[[i]], s[[j]]], {i, Length[s]}, {j, Length[s]}], VertexLabels -> "Name"]特性と関係 (6)
VertexCountとEdgeCountを使って頂点と辺を数える:
g = AdjacencyGraph[(| | | | | |
| - | - | - | - | - |
| 0 | 1 | 1 | 1 | 1 |
| 1 | 0 | 1 | 1 | 1 |
| 1 | 1 | 0 | 1 | 1 |
| 1 | 1 | 1 | 0 | 1 |
| 1 | 1 | 1 | 1 | 0 |)]{VertexCount[g], EdgeCount[g]}VertexListとEdgeListを使って標準的な順序で頂点と辺を列挙する:
g = AdjacencyGraph[(| | | |
| - | - | - |
| 0 | 1 | 0 |
| 0 | 0 | 1 |
| 1 | 0 | 0 |)]{VertexList[g], EdgeList[g]}グラフからAdjacencyMatrixを計算する:
g = AdjacencyGraph[(| | | |
| - | - | - |
| 0 | 1 | 0 |
| 0 | 0 | 1 |
| 1 | 0 | 0 |)];AdjacencyMatrix[g]//MatrixFormCompleteGraph[5]AdjacencyGraph [AdjacencyMatrix[%]]対角線上にある成分がすべて0である隣接行列は自己ループのないグラフを構築する:
AdjacencyGraph[(| | | |
| - | - | - |
| 0 | 1 | 1 |
| 1 | 0 | 1 |
| 1 | 1 | 0 |)]LoopFreeGraphQ[%]AdjacencyGraph[(| | | |
| - | - | - |
| 1 | 1 | 1 |
| 1 | 0 | 1 |
| 1 | 1 | 1 |)]対角の外側のすべての成分が1である隣接行列は完全グラフを構築する:
m = (| | | | | |
| - | - | - | - | - |
| 0 | 1 | 1 | 1 | 1 |
| 1 | 0 | 1 | 1 | 1 |
| 1 | 1 | 0 | 1 | 1 |
| 1 | 1 | 1 | 0 | 1 |
| 1 | 1 | 1 | 1 | 0 |);MatrixPlot[m]AdjacencyGraph[m]CompleteGraphQ[%]関連項目
AdjacencyMatrix WeightedAdjacencyGraph IncidenceGraph KirchhoffGraph
実体タイプ: Graph
インタープリタタイプ: Graph
Function Repository: AdjacencyHypergraph
関連するガイド
-
▪
- グラフと行列 ▪
- グラフの構築と表現 ▪
- グラフプログラミング ▪
- グラフとネットワーク
テキスト
Wolfram Research (2010), AdjacencyGraph, Wolfram言語関数, https://reference.wolfram.com/language/ref/AdjacencyGraph.html.
CMS
Wolfram Language. 2010. "AdjacencyGraph." Wolfram Language & System Documentation Center. Wolfram Research. https://reference.wolfram.com/language/ref/AdjacencyGraph.html.
APA
Wolfram Language. (2010). AdjacencyGraph. Wolfram Language & System Documentation Center. Retrieved from https://reference.wolfram.com/language/ref/AdjacencyGraph.html
BibTeX
@misc{reference.wolfram_2026_adjacencygraph, author="Wolfram Research", title="{AdjacencyGraph}", year="2010", howpublished="\url{https://reference.wolfram.com/language/ref/AdjacencyGraph.html}", note=[Accessed: 11-August-2026]}
BibLaTeX
@online{reference.wolfram_2026_adjacencygraph, organization={Wolfram Research}, title={AdjacencyGraph}, year={2010}, url={https://reference.wolfram.com/language/ref/AdjacencyGraph.html}, note=[Accessed: 11-August-2026]}