位数 n の蝶グラフを与える.
ButterflyGraph[n,b]
基底 b,位数 n の蝶グラフを与える.
ButterflyGraph
位数 n の蝶グラフを与える.
ButterflyGraph[n,b]
基底 b,位数 n の蝶グラフを与える.
詳細とオプション
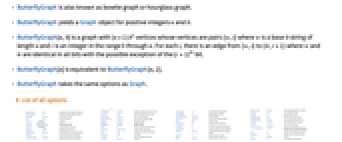
- ButterflyGraphは,蝶ネクタイグラフあるいは砂時計グラフとしても知られている.
- ButterflyGraphは正の整数 n と b についてGraphオブジェクトを与える.
- ButterflyGraph[n,b]はペア{w,i}になった(n+1)bn個の頂点を持つグラフを与える.ただし,w は基底 b で長さが n の列で,i は0から n までの整数である.各 i について,{w,i}から{
,i+1}までの辺がある.ただし,w と
は,(i +1)
番目の部分が異なる可能性があることを除いてすべての部分が等しい. - ButterflyGraph[n]はButterflyGraph[n,2]に等しい.
- ButterflyGraphにはGraphと同じオプションを取る.
全オプションのリスト
例題
すべて開く すべて閉じる例 (2)
オプション (80)
AnnotationRules (2)
DirectedEdges (1)
ButterflyGraph[1]DirectedEdges->Trueを使って有向グラフを生成する:
ButterflyGraph[1, DirectedEdges -> True]EdgeLabels (7)
ButterflyGraph[1, EdgeLabels -> {14 -> "Hello"}]el = EdgeList[ButterflyGraph[1]]ButterflyGraph[1, EdgeLabels -> Table[el[[i]] -> Subscript["e", i], {i, Length[el]}]]ButterflyGraph[1, EdgeLabels -> {12 -> [image], 34 -> [image], 32 -> [image]}]Placedを記号位置と一緒に使って辺に沿ったラベルの置き方を制御する:
Table[ButterflyGraph[1, EdgeLabels -> {34 -> Placed["■■■", p]}, PlotLabel -> p], {p, {"Start", "Middle", "End"}}]Table[ButterflyGraph[1, EdgeLabels -> {23 -> Placed["■■■", p]}, PlotLabel -> p, BaselinePosition -> Bottom], {p, {0, 1 / 4, 1 / 3}}]Table[ButterflyGraph[1, EdgeLabels -> {23 -> Placed["■■■", {1 / 2, p}]}, PlotLabel -> p, BaselinePosition -> Bottom], {p, {{0, 0}, {1 / 2, 1 / 2}, {1, 1}}}]ButterflyGraph[1, EdgeLabels -> {12 -> Placed[{"lbl1", "lbl2"}, {"Start", "End"}]}]ButterflyGraph[1, EdgeLabels -> {12 -> Placed[{"lbl1", "lbl2", "lbl3"}, {"Start", "Middle", "End"}]}]TooltipとStatusAreaからの値で自動的にラベルを付ける:
ButterflyGraph[1, EdgeLabels -> Placed["Name", Tooltip]]ButterflyGraph[1, EdgeLabels -> Placed["Name", StatusArea]]EdgeShapeFunction (6)
EdgeShapeFunctionの組込み設定のリストを得る:
ResourceData["EdgeShapeFunction"]ButterflyGraph[1, EdgeShapeFunction -> "Line"]Table[ButterflyGraph[1, EdgeShapeFunction -> {{ef, "ArrowSize" -> 0.1}}, PlotLabel -> ef], {ef, {"BoxLine", "DiamondLine", "DotLine"}}]Table[ButterflyGraph[1, EdgeShapeFunction -> {{ef, "ArrowSize" -> 0.1}}, PlotLabel -> ef], {ef, ResourceData["EdgeShapeFunction", "FilledArrow"]}]Table[ButterflyGraph[1, EdgeShapeFunction -> {{ef, "ArrowSize" -> 0.1}}, PlotLabel -> ef], {ef, ResourceData["EdgeShapeFunction", "UnfilledArrow"]}]Table[ButterflyGraph[1, EdgeShapeFunction -> {{ef, "ArrowSize" -> 0.1}}, PlotLabel -> ef], {ef, ResourceData["EdgeShapeFunction", "CarvedArrow"]}]ButterflyGraph[1, EdgeShapeFunction -> {12 -> "DotLine"}]ButterflyGraph[1, EdgeShapeFunction -> {12 -> "BoxLine", "DotLine"}]ef[pts_List, e_] :=
Block[{s = 0.015, g = [image]}, {Arrowheads[{{s, 0.33, g}, {s, 0.67, g}}], Arrow[pts]}]ButterflyGraph[1, EdgeShapeFunction -> ef]EdgeShapeFunctionはEdgeStyleと組み合せることができる:
ButterflyGraph[1, EdgeStyle -> Blue, EdgeShapeFunction -> (Line[#1]&)]EdgeShapeFunctionはEdgeStyleより優先順位が高い:
ButterflyGraph[1, EdgeStyle -> Blue, EdgeShapeFunction -> ({Red, Line[#1]}&)]EdgeStyle (2)
EdgeWeight (2)
GraphHighlight (3)
ButterflyGraph[1, VertexSize -> Tiny, GraphHighlight -> {1}]ButterflyGraph[1, VertexSize -> Tiny, GraphHighlight -> {12}]ButterflyGraph[1, VertexSize -> Tiny, GraphHighlight -> {1, 2, 12, 34}]GraphHighlightStyle (2)
GraphHighlightStyleの組込み設定のリストを得る:
ResourceData["GraphHighlightStyle"]GraphHighlightStyleの組込み設定を使う:
ButterflyGraph[1, GraphHighlight -> {1, 12}, VertexSize -> Small, GraphHighlightStyle -> #, PlotLabel -> #]& /@ Select[ResourceData["GraphHighlightStyle"], # =!= Automatic&]GraphLayout (5)
ButterflyGraph[1, GraphLayout -> Automatic]Table[ButterflyGraph[3, GraphLayout -> l, PlotLabel -> l], {l, {"CircularEmbedding", "SpiralEmbedding"}}]Table[ButterflyGraph[3, GraphLayout -> l, PlotLabel -> l], {l, {"SpringEmbedding", "SpringElectricalEmbedding", "HighDimensionalEmbedding"}}]VertexCoordinatesはGraphLayoutの座標を無効にする:
{ButterflyGraph[1, GraphLayout -> "SpringElectricalEmbedding"],
ButterflyGraph[1, GraphLayout -> "SpringElectricalEmbedding", VertexCoordinates -> Table[{i, i}, {i, 0, 3}]]}AbsoluteOptionsを使ってレイアウトアルゴリズムで計算されたVertexCoordinatesを抽出する:
ButterflyGraph[1]AbsoluteOptions[%, VertexCoordinates]PlotTheme (4)
基本テーマ (2)
VertexCoordinates (3)
ButterflyGraph[1]AbsoluteOptionsを使って結果の頂点座標を抽出する:
AbsoluteOptions[%, VertexCoordinates]ellipseLayout[n_, {a_, b_}] := Table[{a Cos[2Pi / n u], b Sin[2Pi / n u]}, {u, 1, n}]Graphics[Point[ellipseLayout[20, {2, 1}]]]ButterflyGraph[2, VertexCoordinates -> ellipseLayout[12, {2, 1}]]VertexCoordinatesはGraphLayoutより優先順位が高い:
ButterflyGraph[1, VertexCoordinates -> Table[{i, i}, {i, 4}], GraphLayout -> "CircularEmbedding"]VertexLabels (13)
ButterflyGraph[1, VertexLabels -> "Name"]ButterflyGraph[1, VertexLabels -> {2 -> "one"}]ButterflyGraph[1, VertexLabels -> Table[i -> Subscript[v, i], {i, 4}]]ButterflyGraph[1, VertexLabels -> {1 -> [image], 2 -> [image], 3 -> [image]}, ImagePadding -> 20]Placedを記号位置と一緒に使って外側位置を含むラベルの置き方を制御する:
Table[ButterflyGraph[1, VertexSize -> 0.1, VertexShapeFunction -> "Square", VertexLabels -> Table[i -> Placed["■■■", p], {i, 4}], PlotLabel -> p, ImagePadding -> 20], {p, {Before, After, Below, Above}}]pl = {{Before, Below}, {After, Below}, {Before, Above}, {After, Above}};Table[ButterflyGraph[1, VertexSize -> 0.1, VertexShapeFunction -> "Square", ImagePadding -> 20, VertexLabels -> Table[i -> Placed["■■■", p], {i, 4}], PlotLabel -> p], {p, pl}]Table[ButterflyGraph[1, VertexSize -> 0.35, VertexLabels -> Table[i -> Placed["■■■", p], {i, 4}], VertexShapeFunction -> "Square", PlotLabel -> p], {p, {Left, Top, Right, Bottom}}]pl = {{Left, Bottom}, {Right, Bottom}, {Left, Top}, {Right, Top}};Table[ButterflyGraph[1, VertexSize -> 0.35, VertexShapeFunction -> "Square", VertexLabels -> Table[i -> Placed["■■■", p], {i, 4}], PlotLabel -> p], {p, pl}]Table[ButterflyGraph[1, VertexSize -> 0.25, VertexShapeFunction -> "Square", VertexLabels -> Table[i -> Placed[[image], p], {i, 4}], PlotLabel -> p, BaselinePosition -> Bottom], {p, {{0, 0}, {1 / 2, 1 / 2}, {1, 1}}}]すべてのラベルを頂点の右上コーナー位置に置き,ラベル内の座標を変化させる:
Table[ButterflyGraph[1, VertexSize -> 0.35, VertexShapeFunction -> "Square", VertexLabels -> Table[i -> Placed[[image], {{1, 1}, p}], {i, 4}], PlotLabel -> p, BaselinePosition -> Bottom], {p, {{0, 0}, {1 / 2, 1 / 2}, {1, 1}}}]ButterflyGraph[1, VertexLabels -> {1 -> Placed[{"lbl1", "lbl2"}, {Above, Below}]}]ButterflyGraph[1, VertexLabels -> {1 -> Placed[{"lbl1", "lbl2", "lbl3", "lbl4"}, {Above, After, Below, Before}]}]Placedの引数を使ってTooltipを含むフォーマットを制御する:
ButterflyGraph[1, VertexLabels -> Placed["Name", Tooltip]]あるいはStatusAreaを含むフォーマットを制御する:
ButterflyGraph[1, VertexLabels -> Placed["Name", StatusArea]]rotateLabel[lab_] := Rotate[lab, 45Degree]ButterflyGraph[1, VertexLabels -> Table[i -> Placed["xxx", Below, rotateLabel], {i, 4}]]panelLabel[lab_] := Panel[lab, FrameMargins -> 0, Background -> Lighter[Yellow, 0.7]]ButterflyGraph[1, VertexLabels -> Table[i -> Placed["xxx", Center, panelLabel], {i, 4}]]hyperlinkLabel[lab_] := Hyperlink[lab, "http://www.wolfram.com"]ButterflyGraph[1, VertexLabels -> Table[i -> Placed["xxx", Center, hyperlinkLabel], {i, 4}]]VertexShape (5)
Graphics,ImageあるいはGraphics3Dを頂点の形に使う:
Table[ButterflyGraph[1, VertexShape -> s, VertexSize -> Medium], {s, {[image], [image], [image]}}]ButterflyGraph[1, VertexShape -> {2 -> [image]}, VertexSize -> Medium]VertexShapeはVertexSizeと組み合せることができる:
Table[ButterflyGraph[1, VertexSize -> s, VertexShape -> [image], PlotLabel -> s], {s, {Small, Large}}]VertexShapeはVertexStyleの影響を受けない:
ButterflyGraph[1, VertexSize -> 0.2, VertexShape -> [image], VertexStyle -> Blue]VertexShapeFunctionはVertexShapeより優先順位が高い:
ButterflyGraph[1, VertexSize -> 0.2, VertexShapeFunction -> "Square", VertexShape -> [image]]VertexShapeFunction (10)
組込みのVertexShapeFunctionコレクションのリストを得る:
ResourceData["VertexShapeFunction"]"Basic"コレクションのVertexShapeFunctionの組込み設定を使う:
ResourceData["VertexShapeFunction", "Basic"]Table[ButterflyGraph[1, VertexShapeFunction -> vf, VertexSize -> 0.2, PlotLabel -> vf], {vf, {"Triangle", "Square", "Rectangle", "Pentagon", "Hexagon", "Octagon"}}]Table[ButterflyGraph[1, VertexShapeFunction -> vf, VertexSize -> 0.2, PlotLabel -> vf], {vf, {"DownTrapezoid", "UpTrapezoid", "Parallelogram", "FiveDown", "Circle", "Diamond", "Star", "Capsule"}}]"Rounded"コレクションのVertexShapeFunctionの組込み設定を使う:
ResourceData["VertexShapeFunction", "Rounded"]Table[ButterflyGraph[1, VertexShapeFunction -> vf, VertexSize -> 0.2, PlotLabel -> vf], {vf, ResourceData["VertexShapeFunction", "Rounded"]}]"Concave"コレクションのVertexShapeFunctionの組込み設定を使う:
ResourceData["VertexShapeFunction", "Concave"]Table[ButterflyGraph[1, VertexShapeFunction -> vf, VertexSize -> 0.2, PlotLabel -> vf], {vf, ResourceData["VertexShapeFunction", "Concave"]}]ButterflyGraph[1, VertexShapeFunction -> { 1 -> "Square"}, VertexSize -> 0.2]ButterflyGraph[1, VertexShapeFunction -> { 1 -> "Square", "Triangle"}, VertexSize -> 0.2]ButterflyGraph[1, VertexShapeFunction -> (Inset[[image], #]&)]vf[{xc_, yc_}, name_, {w_, h_}] :=
Block[{xmin = xc - w, xmax = xc + w, ymin = yc - h, ymax = yc + h},
Polygon[{{xmin, ymin}, {xmax, ymax}, {xmin, ymax}, {xmax, ymin}}]
];ButterflyGraph[1, VertexShapeFunction -> vf, VertexSize -> 0.2]VertexShapeFunctionはVertexStyleと組み合せることができる:
vf1[{xc_, yc_}, name_, {w_, h_}] := Rectangle[{xc - w, yc - h}, {xc + w, yc + h}]ButterflyGraph[1, VertexSize -> 0.2, VertexStyle -> Blue, VertexShapeFunction -> vf1]VertexShapeFunctionはVertexStyleより優先順位が高い:
vf2[{xc_, yc_}, name_, {w_, h_}] := {Red, Rectangle[{xc - w, yc - h}, {xc + w, yc + h}]}ButterflyGraph[1, VertexSize -> 0.2, VertexStyle -> Blue, VertexShapeFunction -> vf2]VertexShapeFunctionはVertexShapeと組み合せることができる:
ButterflyGraph[1, VertexShapeFunction -> "Star", VertexSize -> {1 -> Small, Medium}]VertexShapeFunctionはVertexShapeより優先順位が高い:
ButterflyGraph[1, VertexSize -> 0.3, VertexShapeFunction -> "Star", VertexShape -> [image]]VertexSize (8)
ButterflyGraph[1, VertexSize -> Automatic]Table[ButterflyGraph[1, VertexSize -> s, PlotLabel -> s], {s, {Tiny, Small, Medium, Large}}]Table[ButterflyGraph[1, VertexSize -> s, PlotLabel -> s], {s, 0.1, 1, 0.3}]Table[ButterflyGraph[1, VertexSize -> {"Scaled", s}, PlotLabel -> {"Scaled", s}], {s, 0.1, 1, 0.3}]Table[ButterflyGraph[1, VertexSize -> s, PlotLabel -> s], {s, {{0.1, 0.2}, {0.2, 0.1}}}]ButterflyGraph[1, VertexSize -> {1 -> 0.2, 2 -> 0.3}]VertexSizeはVertexShapeFunctionと組み合せることができる:
Table[ButterflyGraph[1, VertexSize -> s, VertexShapeFunction -> "Square", PlotLabel -> s], {s, {0.05, 0.1, 0.2}}]VertexSizeはVertexShapeと組み合せることができる:
Table[ButterflyGraph[1, VertexSize -> s, VertexShape -> [image], PlotLabel -> s], {s, {0.1, 0.2, 0.4}}]VertexStyle (5)
Table[ButterflyGraph[1, VertexStyle -> style, VertexSize -> 0.2, PlotLabel -> style], {style, {Yellow, EdgeForm[Dashed]}}]ButterflyGraph[1, VertexStyle -> {1 -> Blue, 2 -> Red}, VertexSize -> 0.2]VertexShapeFunctionはVertexStyleと組み合せることができる:
vf1[{xc_, yc_}, name_, {w_, h_}] := Rectangle[{xc - w, yc - h}, {xc + w, yc + h}]ButterflyGraph[1, VertexSize -> 0.2, VertexStyle -> Blue, VertexShapeFunction -> vf1]VertexShapeFunctionはVertexStyleより優先順位が高い:
vf2[{xc_, yc_}, name_, {w_, h_}] := {Red, Rectangle[{xc - w, yc - h}, {xc + w, yc + h}]}ButterflyGraph[1, VertexSize -> 0.2, VertexStyle -> Blue, VertexShapeFunction -> vf2]VertexStyleはBaseStyleと組み合せることができる:
ButterflyGraph[1, VertexStyle -> LightBlue, BaseStyle -> EdgeForm[Dotted], VertexSize -> 0.2]VertexStyleはBaseStyleより優先順位が高い:
ButterflyGraph[1, VertexStyle -> LightBlue, BaseStyle -> Gray, VertexSize -> 0.2]VertexShapeはVertexStyleの影響を受けない:
ButterflyGraph[1, VertexSize -> 0.2, VertexShape -> [image], VertexStyle -> Blue]VertexWeight (2)
アプリケーション (6)
蝶グラフのGraphCenter:
Table[HighlightGraph[#, GraphCenter[#]]&[ButterflyGraph[i, VertexSize -> Large]], {i, 1, 3}]Table[HighlightGraph[#, GraphPeriphery[#]]&[ButterflyGraph[i, VertexSize -> Large]], {i, 1, 3}]VertexEccentricity[ButterflyGraph[2, 2], #]& /@ VertexList[ButterflyGraph[2, 2]]FindVertexEccentricityPath[g_ ? UndirectedGraphQ, u_] /; MemberQ[VertexList[g], u] := Module[{d = GraphDistanceMatrix[g], posu, posv, vl = VertexList[g]}, posu = VertexIndex[g, u];
posv = First@First@Position[d[[posu]], Max[d[[posu]]]];
PathGraph[FindShortestPath[g, u, vl[[posv]]]]]Table[HighlightGraph[g = ButterflyGraph[2, 2], FindVertexEccentricityPath[g, u]], {u, Range[4]}]Table[GraphRadius[ButterflyGraph[i]], {i, 3}]FindRadiusPath[g_ ? UndirectedGraphQ] := Module[{c = First@GraphCenter[g], d, v, pos}, d = Table[GraphDistance[g, c, u], {u, VertexList[g]}];
pos = First@Position[d, Max[d]];
v = First@Part[VertexList[g], pos];
PathGraph[FindShortestPath[g, c, v]]]Table[HighlightGraph[#, FindRadiusPath[#]]&[ButterflyGraph[i, VertexSize -> Tiny]], {i, 3}]Table[GraphDiameter[ButterflyGraph[i]], {i, 3}]FindDiameterPath[g_ ? UndirectedGraphQ] := Module[{d = GraphDistanceMatrix[g], u, v, pos}, pos = First@Position[d, Max[d]];
{u, v} = Part[VertexList[g], pos];
PathGraph[FindShortestPath[g, u, v]]]Table[HighlightGraph[#, FindDiameterPath[#]]&[ButterflyGraph[i, VertexSize -> Tiny]], {i, 3}]ButterflyGraphの頂点次数をハイライトする:
HighlightCentrality[g_, cc_] := HighlightGraph[g, Table[Style[VertexList[g][[i]], ColorData["TemperatureMap"][cc[[i]] / Max[cc]]], {i, VertexCount[g]}]];g = ButterflyGraph[2, VertexSize -> Large];HighlightCentrality[g, VertexDegree[g]]HighlightCentrality[g, ClosenessCentrality[g]]HighlightCentrality[g, EigenvectorCentrality[g]]特性と関係 (3)
ButterflyGraph[n,b]には
の頂点がある:
VertexCount[ButterflyGraph[n, b]]ButterflyGraph[n,b]には
の辺がある:
EdgeCount[ButterflyGraph[n, b]]ButterflyGraphは,オイラーグラフである:
ButterflyGraph[3]EulerianGraphQ[%]関連するガイド
テキスト
Wolfram Research (2010), ButterflyGraph, Wolfram言語関数, https://reference.wolfram.com/language/ref/ButterflyGraph.html.
CMS
Wolfram Language. 2010. "ButterflyGraph." Wolfram Language & System Documentation Center. Wolfram Research. https://reference.wolfram.com/language/ref/ButterflyGraph.html.
APA
Wolfram Language. (2010). ButterflyGraph. Wolfram Language & System Documentation Center. Retrieved from https://reference.wolfram.com/language/ref/ButterflyGraph.html
BibTeX
@misc{reference.wolfram_2026_butterflygraph, author="Wolfram Research", title="{ButterflyGraph}", year="2010", howpublished="\url{https://reference.wolfram.com/language/ref/ButterflyGraph.html}", note=[Accessed: 07-August-2026]}
BibLaTeX
@online{reference.wolfram_2026_butterflygraph, organization={Wolfram Research}, title={ButterflyGraph}, year={2010}, url={https://reference.wolfram.com/language/ref/ButterflyGraph.html}, note=[Accessed: 07-August-2026]}