



CategoricalHistogram
CategoricalHistogram[{c1,c2,…,cn}]
リスト中のカテゴリ要素 c1,c2等の異なるカテゴリについてヒストグラムを作成する.
CategoricalHistogram[data,spec]
指定 spec を用いてカテゴリを決定する.
CategoricalHistogram[data,spec,height]
棒を比較するために高さの値 height を用いる.
CategoricalHistogram[{data1,data2,…},…]
複数のデータ集合 dataiに対するヒストグラムを描画する.
詳細
- CategoricalHistogramは一元分割表としても知られている.
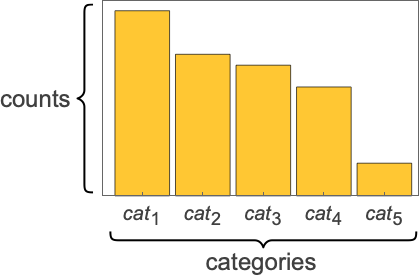
- CategoricalHistogramは,データ中の要素 ciに含まれる各相異なるカテゴリ cat1,cat2,…の出現回数を示す長方形の棒を描画する関数である.
- カテゴリー要素 ciは任意の式でよい.一般には,次の形式を取ることが多い.
-
"name" 文字列値 Entity["type","ent"] Entityオブジェクト Nominal[{cat1,…,catk},ci] 名義カテゴリ要素 Ordinal[{cat1,…,catk},ci] 順序カテゴリ要素 - データ集合 dataiは次の形式および解釈を有する.
-
{c1,c2,…} 要素のリスト ci <k1c1,k2c2,…> 連想からの値 ci <k1data,…> データ集合の連想 TimeSeries,EventSeries,… 時系列データからの値 WeightedData 各要素の個数はその重みである w[datai] データ集合 dataiのラッパー w - CategoricalHistogram[objcspec]は,キー指定 cspec を用いて,Tabularオブジェクト,TimeSeriesオブジェクト,またはEventSeriesオブジェクト obj から値を抽出し,それをプロットする.
- 表形式データをプロットには,以下の指定 cspec が使用できる.
-
k キー k からのヒストグラム要素 {k1,k2,…} キー k1,k2,… からのヒストグラム要素 - 以下のカテゴリ指定 spec を与えることができる.
-
Automatic 自動的に決定されるビン {cat1,cat2,…} 特定のカテゴリのシーケンス {cat1lab1,cat2lab2,…} ラベル labiを伴うカテゴリ catiのシーケンス NominalScale[…] 名義尺度からのカテゴリ OrdinalScale[…] 順序尺度からのカテゴリ n 最も一般的な n 個のカテゴリを使用する "Decreasing","Increasing" 最大または最小のカテゴリを最初に表示する <"prop1"val1,"prop2"val2,…> 特性を用いてカテゴリを選択する - デフォルトで,順序データのビンは順位順である.文字列,名義データ,およびその他のデータ形式のビンは,頻度の降順である.
- 使用可能なカテゴリ特性"propi"には次が含まれる.
-
"MaxCount" 含めるカテゴリの最大数 "MinimumTotalFraction" 含める全データ点の最小割合 "MinimumTotalCount" 含める全データ点の最小数 "MinimumBinFraction" 少なくとも最小割合を満たすカテゴリを含める "MinimumBinCount" 少なくとも最小数を満たすカテゴリを含める "Categories" 含める可能性のあるカテゴリの一覧 "CategoryLabels" カテゴリに使用するラベル "RemainderCategory" 他のカテゴリに含まれないデータの名称 "CategoryOrdering" カテゴリの並べ替え方法 - <"MaxCount"n>を用いると,CategoricalHistogramは大きい方から n 個のカテゴリを表示する.
- <"MinimumFraction"f>を用いると,CategoricalHistogramは,データのうち割合 f が含まれるように十分なカテゴリを表示する.f は0から1のまでの値でなければならない.
- 設定"CategoryLabels"{cat1lab1, ...}は,カテゴリ catiを表示する際に使用するラベル labiを与える.
- 設定"RemainderCategory"other は,"MaxCount","MinBinCount"等の設定によって除外されたカテゴリに対して使用するラベルを指定する.
- 以下は,設定"CategoryOrdering"order の可能な値である.
-
Automatic デフォルト順序を使用する "Decreasing" 最も一般的なものから最も一般的でないものへとカテゴリをソートする "Increasing" 最も一般的でないものから最も一般的なものへとカテゴリをソートする "Canonical" 正規の順序を用いてカテゴリをソートする None 検出された順序でカテゴリをソートする - CategoricalHistogramには,Graphicsと同じオプションに以下の追加・変更を加えたものが使える. [全オプションのリスト]
-
AspectRatio 1/GoldenRatio 縦横比 Axes True 軸を描画するかどうか BarOrigin Bottom 棒の原点位置の指定 BarSpacing Automatic 棒同士の間隔の割合 ChartElementFunction Automatic 棒の生のグラフィックスを生成する方法 ChartElements Automatic 各棒で使用するグラフィックス ColorFunction Automatic 棒に色を付ける方法 ColorFunctionScaling True ColorFunctionの引数を正規化するかどうか Joined False 棒同士を連結するかどうか LabelingFunction Automatic 棒にラベルを付ける方法 LabelingSize Automatic コールアウトおよびラベルの最大サイズ LegendAppearance Automatic 凡例の全体的な外観 PerformanceGoal $PerformanceGoal 最適化を試みる性能上の側面 PlotLabels None データ集合に使うラベル PlotLayout Automatic 使用する全体的なレイアウト PlotLegends None データ要素およびデータセットの凡例 PlotStyle Automatic 棒のスタイル PlotTheme $PlotTheme チャートの全体的なテーマ ScalingFunctions None 各座標をスケーリングする方法 - PlotLegendsの典型的な設定には次が含まれる.
-
None 凡例なし Automatic 凡例を自動的に決定する {lbl1,lbl2,…} lbl1,lbl2,…を凡例ラベルとして用いる Placed[lspec,…] 凡例の配置を指定する - PlotStylesty は,各曲線に使用するスタイルを指定する.指定可能な設定には次が含まれる.
-
{sty1,sty2,…} データ集合に対する一連のスタイル <"key"val,…> データの異なるレベルに対するスタイル要素 - 使用可能なキーは次の通りである.
-
"Base" dataiのすべてに対する全体的なスタイル "Lists" dataiごとのスタイル styi のリスト "Categories" 各カテゴリ catiのスタイル styiのリスト - ColorData["DefaultChartColors"]は,PlotStyleが使用する色のデフォルトのシーケンスを与える.
- 数のデータ集合を表示するために,PlotLayoutの以下の設定が使用できる.
-
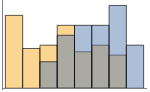
"Overlapped" 重なっているすべてのビンを表示する 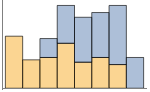
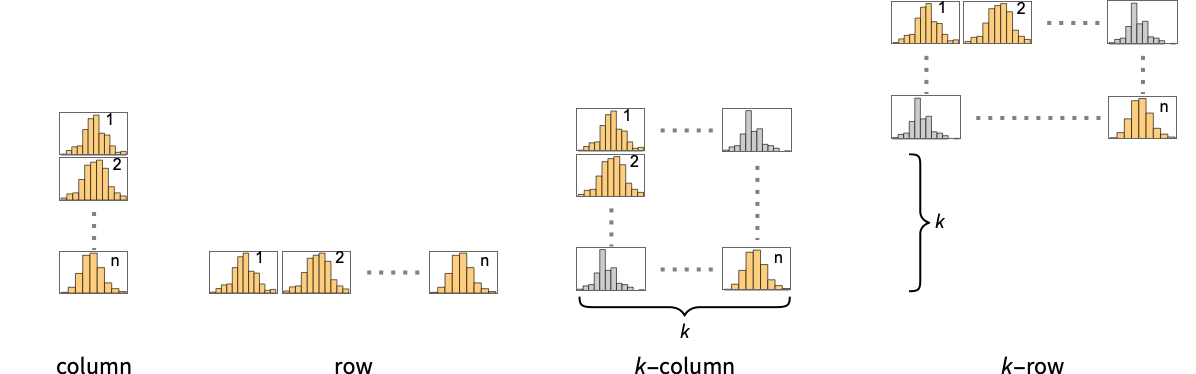
"Stacked" 各ビンごとの数を累積する - 複数のチャートパネルにおいて単一の棒のグループを表示するPlotLayoutの可能な設定には,次のものが含まれる.
-
"Column" パネルの列で棒のグループを別々に使用する "Row" パネルの行で棒のグループを別々に使用する {"Column",k},{"Row",k} 列または行を k 個使用する {"Column",UpTo[k]},{"Row",UpTo[k]} 列または行を最大で k 個まで使用する
全オプションのリスト
例題
すべて開く すべて閉じる例 (7)
CategoricalHistogram[IconizedObject[«Cylinders per car»]]CategoricalHistogram[{IconizedObject[«compact-class cylinders»], IconizedObject[«midsize-class cylinders»], IconizedObject[«subcompact-class cylinders»]}]"CategoryLabels"を使って結果のカテゴリのいくつかの名前を変える:
data = <|"data one" -> <|"a" -> "dog", "b" -> "fish", "c" -> "fish", "d" -> "fish", "e" -> "cat", "f" -> "fish", "g" -> "cat", "h" -> "cat", "i" -> "fish", "j" -> "fish", "k" -> "fish", "l" -> "fish", "m" -> "fish"|>, "data two" -> <|"a" -> "cat", "b" -> "fish", "c" -> "cat", "d" -> "dog", "e" -> "cat", "f" -> "cat", "g" -> "cat", "h" -> "fish", "i" -> "cat", "j" -> "dog", "k" -> "cat", "l" -> "cat", "m" -> "cat"|>|>;CategoricalHistogram[data, <|"CategoryLabels" -> <|"cat" -> "CAT", "dog" -> "DOG"|>|>]CategoricalHistogram[IconizedObject[«Cylinders per car»], PlotStyle -> "DarkRainbow"]複数のデータ集合の場合は,設定されたスタイルはカテゴリの由来となるデータ集合に基づいている:
CategoricalHistogram[{IconizedObject[«compact-class cylinders»], IconizedObject[«midsize-class cylinders»], IconizedObject[«subcompact-class cylinders»]}, PlotStyle -> "DarkRainbow"]代りに,PlotStyle{style,None}を使ってカテゴリごとに色スキームを使う:
CategoricalHistogram[{IconizedObject[«compact-class cylinders»], IconizedObject[«midsize-class cylinders»], IconizedObject[«subcompact-class cylinders»]}, PlotStyle -> {"DarkRainbow", None}]CategoricalHistogram[IconizedObject[«Cylinders per car»], ChartElements -> [image]]Table[CategoricalHistogram[{IconizedObject[«compact-class cylinders»], IconizedObject[«midsize-class cylinders»], IconizedObject[«subcompact-class cylinders»]}, PlotLabel -> l, ChartLayout -> l], {l, {"Percentile", "Stacked"}}]スコープ (28)
データとレイアウト (15)
CategoricalHistogram[IconizedObject[«Cars per fuel type»]]CategoricalHistogram[IconizedObject[«Cars per fuel type»], {"r", "p", "e"}]CategoricalHistogram[IconizedObject[«Cars per fuel type»], 4]CategoricalHistogram[IconizedObject[«Cars per fuel type»], <|"CategoryOrdering" -> "Increasing"|>]CategoricalHistogram[IconizedObject[«Cars per fuel type»], <|"CategoryOrdering" -> "Alphabetic"|>]CategoricalHistogram[IconizedObject[«Cars per fuel type»], <|"MinimumBinCount" -> 50|>]個数が最低の合計百分率の閾値22%に合致するカテゴリだけを表示する:
CategoricalHistogram[IconizedObject[«Cars per fuel type»], <|"MinimumBinFraction" -> .22|>]最小の合計百分率の閾値が得られるまで,デフォルトの順序を用いてカテゴリを取得する:
CategoricalHistogram[IconizedObject[«Cars per fuel type»], <|"MinimumTotalFraction" -> .95|>]少なくとも最小合計百分率の5%閾値に達するまで,特定の順序を用いてカテゴリを取得する:
CategoricalHistogram[IconizedObject[«Cars per fuel type»], <|"CategoryOrdering" -> "Increasing", "MinimumTotalFraction" -> .05|>]CategoricalHistogram[IconizedObject[«Cars per fuel type»], <|"CategoryLabels" -> <|"c" -> "Label 1", "d" -> "Label 2"|>|>]カテゴリ間で同じデータ集合に属するデータは同じようにスタイル付けされる:
CategoricalHistogram[{IconizedObject[«compact-class cylinders»], IconizedObject[«midsize-class cylinders»], IconizedObject[«subcompact-class cylinders»]}, PlotLegends -> Automatic]CategoricalHistogram[<|"compact" -> IconizedObject[«compact-class cylinders»], "midsize" -> IconizedObject[«midsize-class cylinders»], "Subcompact" -> IconizedObject[«subcompact-class cylinders»]|>]data = <|"data one" -> <|"a" -> "dog", "b" -> "fish", "c" -> "fish", "d" -> "fish", "e" -> "cat", "f" -> "fish", "g" -> "cat", "h" -> "cat", "i" -> "fish", "j" -> "fish", "k" -> "fish", "l" -> "fish", "m" -> "fish"|>, "data two" -> <|"a" -> "cat", "b" -> "fish", "c" -> "cat", "d" -> "dog", "e" -> "cat", "f" -> "cat", "g" -> "cat", "h" -> "fish", "i" -> "cat", "j" -> "dog", "k" -> "cat", "l" -> "cat", "m" -> "cat"|>|>;CategoricalHistogram[data]CategoricalHistogram[data, ChartLegends -> Automatic]Table[CategoricalHistogram[{IconizedObject[«compact-class cylinders»], IconizedObject[«midsize-class cylinders»], IconizedObject[«subcompact-class cylinders»]}, PlotLabel -> l, ChartLayout -> l], {l, {"Percentile", "Stacked"}}]CategoricalHistogram[{IconizedObject[«compact-class cylinders»], IconizedObject[«midsize-class cylinders»], IconizedObject[«subcompact-class cylinders»]}, PlotLabel -> "Overlapped", ChartLayout -> "Overlapped"]CategoricalHistogram[{IconizedObject[«compact-class cylinders»], IconizedObject[«midsize-class cylinders»], IconizedObject[«subcompact-class cylinders»]}, ChartLayout -> "Column"]data = {"Cat", "Dog", "Rabbit", "Cat", "Rabbit", "Bird", "Rabbit", "Dog", "Dog", "Dog"};
Table[CategoricalHistogram[data, BarOrigin -> o, PlotLabel -> o, ImageSize -> Small], {o, {Bottom, Left, Top, Right}}]表形式データ (1)
「タイタニック号」の乗客,東急,性別についての情報を含む表形式データを取得する:
titanic = ToTabular[ResourceData["Sample Data: Titanic Survival"]]乗客クラスのHistogramを作成する:
CategoricalHistogram[titanic -> "Class"]groupdata = GroupBy[titanic, #Class&, Normal[#[All, "Sex"]]&];CategoricalHistogram[groupdata, ChartLegends -> Automatic]CategoricalHistogram[groupdata, ChartLegends -> Automatic, ChartLayout -> "Stacked"]ラッパー (1)
スタイル付けと外観 (5)
CategoricalHistogram[IconizedObject[«Male Palmer Penguins Species»], PlotStyle -> 60]CategoricalHistogram[{IconizedObject[«Female Palmer Penguins Species»], IconizedObject[«Male Palmer Penguins Species»]}, PlotStyle -> {Red, Green}]ColorDataから任意の勾配あるいはインデックス付きの色スキームを使う:
{CategoricalHistogram[{IconizedObject[«Female Palmer Penguins Species»], IconizedObject[«Male Palmer Penguins Species»]}, PlotStyle -> "Pastel"], CategoricalHistogram[{IconizedObject[«Female Palmer Penguins Species»], IconizedObject[«Male Palmer Penguins Species»]}, PlotStyle -> {"Pastel", None}]}ChartBaseStyleはすべてのグラフ要素の初期スタイルの設定に使うことができる:
CategoricalHistogram[{IconizedObject[«Female Palmer Penguins Species»], IconizedObject[«Male Palmer Penguins Species»]}, ChartBaseStyle -> EdgeForm[Dotted]]CategoricalHistogram[IconizedObject[«Male Palmer Penguins Species»], ChartElements -> Graphics[{Red, Circle[]}]]ChartElementData["Histogram"]Table[CategoricalHistogram[IconizedObject[«Male Palmer Penguins Species»], ChartElementFunction -> f], {f, {"GlassRectangle", "GradientScaleRectangle"}}]詳細設定には,パレット ▶ チャートエレメントスキームを使う:
CategoricalHistogram[IconizedObject[«Male Palmer Penguins Species»], ChartElementFunction -> ChartElementDataFunction["SegmentScaleRectangle", "Segments" -> 7, "ColorScheme" -> "SolarColors"]]CategoricalHistogram[IconizedObject[«Male Palmer Penguins Species»], PlotTheme -> "Monochrome"]ラベルと凡例 (6)
LabelingFunctionを使って棒に値のラベルを付ける:
CategoricalHistogram[IconizedObject[«compact-class cylinders»], LabelingFunction -> Above]ChartElementsはPlotStyleの設定を上書きすることがある:
CategoricalHistogram[IconizedObject[«compact-class cylinders»], ChartElements -> [image], PlotStyle -> {RGBColor[0.93, 0.27, 0.27], RGBColor[0.14, 0.8, 0.14], RGBColor[0.4, 0.6, 1]}]カスタム関数内でPlacedを使って配置とフォーマットを整える:
labeler[v_, {i_, j_}, {ri_, cj_}] := Placed[{StringJoin[ToString[First@cj], "-cyl"], v}, Above, Column]CategoricalHistogram[IconizedObject[«compact-class cylinders»], LabelingFunction -> labeler]CategoricalHistogram[IconizedObject[«compact-class cylinders»], ChartLegends -> {"Cat1", "Cat2", "Cat3"}, PlotStyle -> "Pastel"]AssociationベースのPlotStyleを使ってカテゴリを示す:
CategoricalHistogram[IconizedObject[«compact-class cylinders»], ChartLegends -> {"Cat1", "Cat2", "Cat3"}, PlotStyle -> <|"Categories" -> "Pastel"|>]CategoricalHistogram[{IconizedObject[«compact-class cylinders»], IconizedObject[«midsize-class cylinders»], IconizedObject[«subcompact-class cylinders»]}, PlotStyle -> <|"Categories" -> "Pastel"|>, PlotLegends -> <|"Categories" -> {"Cat1", "Cat2", "Cat3"}|>]CategoricalHistogram[{IconizedObject[«compact-class cylinders»], IconizedObject[«midsize-class cylinders»], IconizedObject[«subcompact-class cylinders»]}, ChartLegends -> {"Dataset1", "Dataset2", "Dataset3"}, PlotStyle -> "Pastel"]CategoricalHistogram[{IconizedObject[«compact-class cylinders»], IconizedObject[«midsize-class cylinders»], IconizedObject[«subcompact-class cylinders»]}, PlotStyle -> <|"Lists" -> "Pastel"|>, PlotLegends -> <|"Lists" -> {"Dataset1", "Dataset2", "Dataset3"}|>]Placedを使って凡例の配置に影響を与える:
Table[CategoricalHistogram[{IconizedObject[«compact-class cylinders»], IconizedObject[«midsize-class cylinders»], IconizedObject[«subcompact-class cylinders»]}, ChartLegends -> Placed[{"ccc1", "ccc2", "ccc3"}, p], PlotStyle -> "Pastel"], {p, {Below, Above}}]オプション (86)
AspectRatio (3)
デフォルトでは,CategoricalHistogramは固定の高さ対幅の比率をプロットに対して使用する:
CategoricalHistogram[IconizedObject[«Tabular Titanic»] -> "Class"]AspectRatio1を用いて,高さを幅と同じにする:
CategoricalHistogram[IconizedObject[«Tabular Titanic»] -> "Class", AspectRatio -> 1]AspectRatioFullは,高さと幅を調整して他の構成要素の内側に隙間なく収まるようにする:
plot = CategoricalHistogram[IconizedObject[«Tabular Titanic»] -> "Class", AspectRatio -> Full];{Framed[Pane[plot, {50, 100}]], Framed[Pane[plot, {100, 100}]], Framed[Pane[plot, {100, 75}]]}Axes (3)
デフォルトでは,Axesが描画される:
CategoricalHistogram[IconizedObject[«Tabular Titanic»] -> "Class"]CategoricalHistogram[IconizedObject[«Tabular Titanic»] -> "Class", Axes -> False]{CategoricalHistogram[IconizedObject[«Tabular Titanic»] -> "Class", Axes -> {True, False}], CategoricalHistogram[IconizedObject[«Tabular Titanic»] -> "Class", Axes -> {False, True}]}AxesLabel (3)
CategoricalHistogram[IconizedObject[«Tabular Titanic»] -> "Class"]
CategoricalHistogram[IconizedObject[«Tabular Titanic»] -> "Class", AxesLabel -> "Counts"]CategoricalHistogram[IconizedObject[«Tabular Titanic»] -> "Class", AxesLabel -> {"X-Label", "Counts"}]AxesOrigin (2)
CategoricalHistogram[IconizedObject[«Tabular Titanic»] -> "Class"]AxesOriginを用いて,軸が交差する位置を指定する:
CategoricalHistogram[IconizedObject[«Tabular Titanic»] -> "Class", AxesOrigin -> {0, -100}]AxesStyle (4)
CategoricalHistogram[IconizedObject[«Tabular Titanic»] -> "Class", AxesStyle -> RGBColor[0.93, 0.27, 0.27]]CategoricalHistogram[IconizedObject[«Tabular Titanic»] -> "Class", AxesStyle -> {RGBColor[0.93, 0.27, 0.27], RGBColor[0.4, 0.6, 1]}]CategoricalHistogram[IconizedObject[«Tabular Titanic»] -> "Class", AxesStyle -> RGBColor[0.14, 0.8, 0.14], TicksStyle -> RGBColor[0.93, 0.27, 0.27]]CategoricalHistogram[IconizedObject[«Tabular Titanic»] -> "Class", AxesStyle -> RGBColor[0.14, 0.8, 0.14], LabelStyle -> RGBColor[0.93, 0.27, 0.27]]BarOrigin (2)
棒の原点がTop上にあるように変更する:
CategoricalHistogram[IconizedObject[«Tabular Titanic»] -> "Class", BarOrigin -> Top]{CategoricalHistogram[IconizedObject[«Tabular Titanic»] -> "Class", BarOrigin -> Left], CategoricalHistogram[IconizedObject[«Tabular Titanic»] -> "Class", BarOrigin -> Right]}BarSpacing (4)
CategoricalHistogram[IconizedObject[«Cylinders per car»]]CategoricalHistogram[{IconizedObject[«compact-class cylinders»], IconizedObject[«midsize-class cylinders»], IconizedObject[«subcompact-class cylinders»]}]Table[CategoricalHistogram[IconizedObject[«Cylinders per car»], BarSpacing -> s, PlotLabel -> s], {s, {0, Large, 1, -0.3}}]Table[CategoricalHistogram[{IconizedObject[«compact-class cylinders»], IconizedObject[«midsize-class cylinders»], IconizedObject[«subcompact-class cylinders»]}, BarSpacing -> s, PlotLabel -> s], {s, {0, Large, 1, -0.3}}]カテゴリ内の棒同士およびカテゴリ同士の間には,明示的な間隔を使用する:
Table[CategoricalHistogram[{IconizedObject[«compact-class cylinders»], IconizedObject[«midsize-class cylinders»], IconizedObject[«subcompact-class cylinders»]}, BarSpacing -> s, PlotLabel -> s], {s, {Automatic, {None, 2}, {0.5, 3}, {None, None}}}]CategoricalHistogram[IconizedObject[«Cylinders per car»], BarSpacing -> None]
BarChart[{{16, 8, 4}, {5, 3, 2}}, BarSpacing -> None]CategoricalHistogram[{IconizedObject[«compact-class cylinders»], IconizedObject[«midsize-class cylinders»], IconizedObject[«subcompact-class cylinders»]}, BarSpacing -> {None, None}]ChartElements (8)
任意のGraphicsオブジェクトに基づいて,図式的なグラフを作成する:
CategoricalHistogram[IconizedObject[«Mushroom Classification»] -> "CapSurface", ChartElements -> Graphics[Disk[]]]Graphics3Dを使用:
CategoricalHistogram[IconizedObject[«Mushroom Classification»] -> "CapSurface", ChartElements -> Graphics3D[Sphere[]]]CategoricalHistogram[IconizedObject[«Mushroom Classification»] -> "CapSurface", ChartElements -> ExampleData[{"TestImage", "House"}]]CategoricalHistogram[IconizedObject[«Mushroom Classification»] -> "CapSurface", ChartElements -> {[image], All}]Allを幅または高さに用いると,その方向は棒の全体サイズまで伸長され,Scaledを用いると棒の一部分の比率まで伸長される:
Table[CategoricalHistogram[IconizedObject[«Mushroom Classification»] -> "CapSurface", ChartElements -> {[image], s}, PlotLabel -> s], {s, {{Scaled[1 / 2], All}, {All, Scaled[1 / 2]}}}]CategoricalHistogram[{IconizedObject[«1rst»], IconizedObject[«2nd»], IconizedObject[«3rd»]}, ChartElements -> {[image], [image], [image]}]CategoricalHistogram[{IconizedObject[«1rst»], IconizedObject[«2nd»], IconizedObject[«3rd»]}, ChartElements -> {{[image], [image]}, None}]スタイルは,PlotStyle等を通じて設定されたスタイルから継承される:
CategoricalHistogram[{IconizedObject[«1rst»], IconizedObject[«2nd»], IconizedObject[«3rd»]}, ChartElements -> {[image], [image], [image]}, PlotStyle -> Green]Styleは,ChartStyleの設定を上書きできる:
CategoricalHistogram[{IconizedObject[«1rst»], Style[IconizedObject[«2nd»], Black], IconizedObject[«3rd»]}, ChartElements -> {[image], [image], [image]}, PlotStyle -> {StandardRed, StandardGreen, StandardBlue}]グラフイックス内で明示的に設定されたスタイルは,他のスタイル設定を上書きする:
CategoricalHistogram[{IconizedObject[«1rst»], IconizedObject[«2nd»], IconizedObject[«3rd»]}, ChartElements -> [image], PlotStyle -> Green]CategoricalHistogram[{IconizedObject[«1rst»], Style[IconizedObject[«2nd»], Black], IconizedObject[«3rd»]}, ChartElements -> [image]]g = Graphics3D[{EdgeForm[], Specularity[White, 30], Cylinder[]}, ViewPoint -> {0, -Infinity, 0}, Boxed -> False, Lighting -> "Neutral", PlotRangePadding -> 0];CategoricalHistogram[{IconizedObject[«1rst»], IconizedObject[«2nd»], IconizedObject[«3rd»]}, ChartElements -> {g, All}, PlotStyle -> Purple]ColorFunction (3)
CategoricalHistogramにおいては,ColorFunctionは色付けのために高さの値を計る:
CategoricalHistogram[IconizedObject[«Mushroom Classification»] -> "CapShape", ColorFunction -> Function[{height}, ColorData["SolarColors"][height]]]計測されていない高さの値を使用するには,ColorFunctionScalingFalseを使用する:
CategoricalHistogram[IconizedObject[«Mushroom Classification»] -> "CapShape", ColorFunction -> (If[# < 1000, StandardGreen, StandardRed]&), ColorFunctionScaling -> False]ColorFunctionは,PlotStyle内のスタイルを上書きする:
CategoricalHistogram[IconizedObject[«Mushroom Classification»] -> "CapShape", PlotStyle -> Red, ColorFunction -> "Pastel"]異なるスタイル効果を組み合せるにはColorFunctionを使用する:
CategoricalHistogram[IconizedObject[«Mushroom Classification»] -> "CapShape", ColorFunction -> Function[{height}, Opacity[height]], PlotStyle -> Red]ColorFunctionScaling (2)
CategoricalHistogram[IconizedObject[«Mushroom Classification»] -> "CapShape", ColorFunction -> Function[{height}, ColorData["SolarColors"][height]]]計られていない高さの値を使用するには,ColorFunctionScalingFalseを使用する.
CategoricalHistogram[IconizedObject[«Mushroom Classification»] -> "CapShape", ColorFunction -> (If[# < 1000, StandardGreen, StandardRed]&), ColorFunctionScaling -> False]Frame (4)
CategoricalHistogramはデフォルトでは枠を使用しない:
CategoricalHistogram[IconizedObject[«Mushroom Classification»] -> "CapShape"]FrameTrueを用いて,プロットの周囲に枠を描画する:
CategoricalHistogram[IconizedObject[«Mushroom Classification»] -> "CapShape", Frame -> True]CategoricalHistogram[IconizedObject[«Mushroom Classification»] -> "CapShape", Frame -> {{True, True}, {False, False}}]CategoricalHistogram[IconizedObject[«Mushroom Classification»] -> "CapShape", Frame -> {{True, False}, {True, False}}]FrameLabel (4)
CategoricalHistogram[IconizedObject[«Mushroom Classification»] -> "CapShape", Frame -> True, FrameLabel -> {"Mushroom Classification"}]枠ラベルは,デフォルトでは下辺および左辺の枠辺に配置される:
CategoricalHistogram[IconizedObject[«Mushroom Classification»] -> "CapShape", Frame -> True, FrameLabel -> {"Bottom", "Left"}]CategoricalHistogram[IconizedObject[«Mushroom Classification»] -> "CapShape", Frame -> True, FrameLabel -> {{"left", "right"}, {"bottom", "top"}}]ラベルと枠目盛ラベルの両方に対して,カスタマイズしたスタイルを使用する:
CategoricalHistogram[IconizedObject[«Mushroom Classification»] -> "CapShape", Frame -> True, FrameLabel -> {{"left", "right"}, {"bottom", "top"}}, LabelStyle -> Directive[Bold, Gray]]FrameStyle (2)
CategoricalHistogram[IconizedObject[«Mushroom Classification»] -> "CapShape", Frame -> True, FrameStyle -> Directive[StandardRed, Thick]]CategoricalHistogram[IconizedObject[«Mushroom Classification»] -> "CapShape", Frame -> True, FrameStyle -> {{Directive[StandardGreen, Thick], Red}, {Directive[Gray, Thick], Blue}}]FrameTicks (7)
CategoricalHistogram[IconizedObject[«Mushroom Classification»] -> "CapShape", Frame -> True]Allを用いて,すべての辺に目盛ラベルを含める:
CategoricalHistogram[IconizedObject[«Mushroom Classification»] -> "CapShape", Frame -> True, FrameTicks -> All]CategoricalHistogram[IconizedObject[«Mushroom Classification»] -> "CapShape", Frame -> True, FrameTicks -> {{{1000, 1500, 3000}, Automatic}, {Automatic, Automatic}}]CategoricalHistogram[IconizedObject[«Mushroom Classification»] -> "CapShape", Frame -> True, FrameTicks -> {{{{250, "minimum"}, {1000, "Good"}, {3000, "Too many"}}, Automatic}, {Automatic, Automatic}}]CategoricalHistogram[IconizedObject[«Mushroom Classification»] -> "CapShape", Frame -> True, FrameTicks -> {{{{250, "minimum", .9}, {1000, "Good", .5}, {3000, "Too many", .35}}, Automatic}, {Automatic, Automatic}}]CategoricalHistogram[IconizedObject[«Mushroom Classification»] -> "CapShape", Frame -> True, FrameTicks -> {{{{250, "minimum", {.9, .05}}, {1000, "Good", {.5, .1}}, {3000, "Too many", {.35, .15}}}, Automatic}, {Automatic, Automatic}}]CategoricalHistogram[IconizedObject[«Mushroom Classification»] -> "CapShape", Frame -> True, FrameTicks -> {{{{250, "minimum", {.9, .05}, Directive[Thick, RGBColor[0.4, 0.6, 1]]}, {1000, "Good", {.5, .1}, Directive[Thick, RGBColor[0.14, 0.8, 0.14]]}, {3000, "Too many", {.35, .15}, Directive[Thick, RGBColor[0.93, 0.27, 0.27], Dashed]}}, Automatic}, {Automatic, Automatic}}]FrameTicksStyle (3)
デフォルトでは,枠目盛および枠目盛ラベルは,枠と同じスタイルを使用する:
CategoricalHistogram[IconizedObject[«Tabular Titanic»] -> "Class", Frame -> True, FrameStyle -> Directive[RGBColor[0.93, 0.27, 0.27]]]CategoricalHistogram[IconizedObject[«Tabular Titanic»] -> "Class", Frame ->
True, FrameTicksStyle -> Directive[RGBColor[0.4, 0.6, 1], Thick]]CategoricalHistogram[IconizedObject[«Tabular Titanic»] -> "Class", Frame -> True, FrameTicksStyle -> {{Directive[RGBColor[0.09333333333333335, 0.5333333333333334, 0.09333333333333335], Thick], RGBColor[0.4, 0.6, 1]}, {Directive[RGBColor[0.93, 0.27, 0.27], Thick], Red}}]ImageSize (7)
Tiny, Small, MediumおよびLargeのような名前付きサイズを使用する:
{CategoricalHistogram[IconizedObject[«Tabular Titanic»] -> "Class", ImageSize -> Tiny], CategoricalHistogram[IconizedObject[«Tabular Titanic»] -> "Class", ImageSize -> Small]}{CategoricalHistogram[IconizedObject[«Tabular Titanic»] -> "Class", ImageSize -> 150], CategoricalHistogram[IconizedObject[«Tabular Titanic»] -> "Class", AspectRatio -> 1.5, ImageSize -> 150]}{CategoricalHistogram[IconizedObject[«Tabular Titanic»] -> "Class", ImageSize -> {Automatic, 150}], CategoricalHistogram[IconizedObject[«Tabular Titanic»] -> "Class", AspectRatio -> 2, ImageSize -> {Automatic, 150}]}{CategoricalHistogram[IconizedObject[«Tabular Titanic»] -> "Class", ImageSize -> UpTo[200]], CategoricalHistogram[IconizedObject[«Tabular Titanic»] -> "Class", AspectRatio -> 2, ImageSize -> UpTo[200]]}CategoricalHistogram[IconizedObject[«Tabular Titanic»] -> "Class", ImageSize -> {200, 200}, Background -> GrayLevel[0.62]]AspectRatioFullを設定すると,使用可能な空間が埋められる:
CategoricalHistogram[IconizedObject[«Tabular Titanic»] -> "Class", AspectRatio -> Full, ImageSize -> {200, 200}, Background -> GrayLevel[0.62]]{CategoricalHistogram[IconizedObject[«Tabular Titanic»] -> "Class", ImageSize -> {UpTo[150], UpTo[100]}], CategoricalHistogram[IconizedObject[«Tabular Titanic»] -> "Class", AspectRatio -> 2, ImageSize -> {UpTo[150], UpTo[150]}]}オブジェクト内で使用可能な空間を埋めるには,ImageSizeFullを使用する:
Framed[Pane[CategoricalHistogram[IconizedObject[«Tabular Titanic»] -> "Class", ImageSize -> Full, AspectRatio -> Full, Background -> GrayLevel[0.62]], {200, 100}]]Framed[Pane[CategoricalHistogram[IconizedObject[«Tabular Titanic»] -> "Class", AspectRatio -> Full, ImageSize -> {Scaled[0.5], Scaled[0.5]}, Background -> GrayLevel[0.62]], {200, 100}]]Joined (3)
CategoricalHistogram[IconizedObject[«Mushroom Classification»] -> "CapShape"]CategoricalHistogram[IconizedObject[«Mushroom Classification»] -> "CapShape", Joined -> Automatic]CategoricalHistogram[IconizedObject[«Mushroom Classification»] -> "CapShape", Joined -> True]CategoricalHistogram[{IconizedObject[«1rst»], IconizedObject[«2nd»], IconizedObject[«3rd»]}, Joined -> True, PlotLayout -> "Stacked"]LabelingFunction (5)
Tooltipを介した値によって、自動ラベル付けを用いる:
CategoricalHistogram[IconizedObject[«Mushroom Classification»] -> "CapShape", LabelingFunction -> Automatic]CategoricalHistogram[IconizedObject[«Mushroom Classification»] -> "CapShape", LabelingFunction -> None]```{CategoricalHistogram[IconizedObject[«Mushroom Classification»] -> "CapShape", LabelingFunction -> Above, Ticks -> None], CategoricalHistogram[IconizedObject[«Mushroom Classification»] -> "CapShape", LabelingFunction -> Center, Ticks -> None]}棒に対して相対的な,スケーリング座標を用いてラベルを配置する:
CategoricalHistogram[IconizedObject[«Mushroom Classification»] -> "CapShape", LabelingFunction -> {{0, 1}, {0, 0}}, BarSpacing -> 0.5, Ticks -> None]Calloutを使用して,ラベルを自動的に配置する:
CategoricalHistogram[IconizedObject[«Mushroom Classification»] -> "CapShape", LabelingFunction -> (Callout[Row[{"$", #}], Automatic]&)]記号的位置指定を用いてCalloutラベルを配置する:
CategoricalHistogram[IconizedObject[«Mushroom Classification»] -> "CapShape", LabelingFunction -> (Callout[#, Above]&)]PlotLegends (5)
CategoricalHistogram[{IconizedObject[«1rst»], IconizedObject[«2nd»], IconizedObject[«3rd»]}, PlotLegends -> {"1rst", "2nd", "3rd"}]データ集合の凡例を指定するには,Association形式を使用する:
CategoricalHistogram[{IconizedObject[«1rst»], IconizedObject[«2nd»], IconizedObject[«3rd»]}, PlotLegends -> <|"Lists" -> {"1st", "2nd", "3rd"}|>]CategoricalHistogram[{IconizedObject[«1rst»], IconizedObject[«2nd»], IconizedObject[«3rd»]}, PlotLegends -> {None, "Second Class", None}]カテゴリの凡例を指定するには,Association形式を用いる:
CategoricalHistogram[{IconizedObject[«1rst»], IconizedObject[«2nd»], IconizedObject[«3rd»]}, PlotStyle -> <|"Categories" -> {StandardGreen, StandardBlue}|>, PlotLegends -> <|"Categories" -> {"Male", "Female"}|>]Placedを用いて,凡例の配置を整える:
Table[CategoricalHistogram[{IconizedObject[«1rst»], IconizedObject[«2nd»], IconizedObject[«3rd»]}, PlotStyle -> Automatic, PlotLegends -> <|"Lists" -> Placed[{"1rst", "2nd", "3rd"}, p]|>], {p, {Below, Above}}]PlotStyle (6)
カテゴリのスタイル指定にはPlotStyleを使用する:
CategoricalHistogram[IconizedObject[«Cylinders per car»], PlotStyle -> StandardCyan]CategoricalHistogram[{IconizedObject[«compact-class cylinders»], IconizedObject[«midsize-class cylinders»], IconizedObject[«subcompact-class cylinders»]}, PlotStyle -> {RGBColor[0.93, 0.27, 0.27], RGBColor[0.98, 0.56, 0.17], RGBColor[1, 0.75, 0]}]CategoricalHistogram[{IconizedObject[«compact-class cylinders»], IconizedObject[«midsize-class cylinders»], IconizedObject[«subcompact-class cylinders»]}, PlotStyle -> <|"Lists" -> {RGBColor[0, 0.35, 0], RGBColor[0.07, 0.25, 0.6], RGBColor[0.42, 0.03, 0.42]}|>]CategoricalHistogram[{IconizedObject[«compact-class cylinders»], IconizedObject[«midsize-class cylinders»], IconizedObject[«subcompact-class cylinders»]}, PlotStyle -> <|"Categories" -> {StandardRed, StandardOrange, StandardYellow, StandardMagenta}|>]ColorFunctionはPlotStyleの設定を上書きする:
CategoricalHistogram[IconizedObject[«Cylinders per car»], PlotStyle -> StandardCyan, ColorFunction -> "SolarColors"]ChartElementsは,PlotStyleの設定を上書きする場合がある:
CategoricalHistogram[IconizedObject[«Cylinders per car»], PlotStyle -> StandardCyan, ChartElements -> [image]]PlotTheme (2)
シンプルな目盛と格子線を持つ高コントラストの配色テーマを使用する:
CategoricalHistogram[{IconizedObject[«1rst»], IconizedObject[«2nd»], IconizedObject[«3rd»]}, PlotTheme -> "Business"]CategoricalHistogram[{IconizedObject[«1rst»], IconizedObject[«2nd»], IconizedObject[«3rd»]}, PlotTheme -> "Business", PlotStyle -> <|"Lists" -> 56|>]ScalingFunctions (4)
CategoricalHistogram[IconizedObject[«Mushroom Classification»] -> "CapShape"]カウント数の小さいカテゴリの可視性を向上させるために, 方向では対数スケールを使用する:
CategoricalHistogram[IconizedObject[«Mushroom Classification»] -> "CapShape", ScalingFunctions -> "Log"]CategoricalHistogram[IconizedObject[«Mushroom Classification»] -> "CapShape", ScalingFunctions -> {-Log[#]&, Exp[-#]&}]TicksおよびGridLinesにおける位置は自動的にスケールされる:
CategoricalHistogram[IconizedObject[«Mushroom Classification»] -> "CapShape", ScalingFunctions -> "Log", Ticks -> {Automatic, 2 ^ Range[12]}, GridLines -> {None, 2 ^ Range[12]}]アプリケーション (5)
さまざまな生息地におけるキノコの出現頻度を,いくつかの特性とともに分析する:
table = ToTabular[ResourceData["Sample Data: Mushroom Classification"]]データ集合内のキノコの可食性を確認するためにヒストグラムを生成する:
CategoricalHistogram[table -> "Class"]GroupByを用いて,データを生息地ごとに,さらに食用であるか否かによって分割する:
classperhabitat = GroupBy[table, #Class&, Normal[#[All, "Habitat"]]&];
CategoricalHistogram[classperhabitat, BarSpacing -> {Automatic, 3.5}, PlotLegends -> Automatic]カテゴリが大きすぎる場合には,カテゴリの一部だけを表示するためにLabelingSizeを用いる:
CategoricalHistogram[classperhabitat, BarSpacing -> {Automatic, 4}, PlotLegends -> Automatic, AspectRatio -> 1 / 2, LabelingSize -> 32]tabulardata = ResourceData["Sample Tabular Data: Diamonds"];CategoricalHistogram[tabulardata -> "cut"]GroupByとCategoricalHistogramを用いて,ダイヤモンドのカット数を色別に表示する:
groupdata = GroupBy[tabulardata, #cut&, Normal[#[All, "color"]]&];CategoricalHistogram[groupdata, ChartLegends -> Automatic]全体の数の少なくとも15%以上を占めるカテゴリのみの表示には,"MinimumBinFraction"を使用する:
CategoricalHistogram[groupdata, <|"MinimumBinFraction" -> .15|>, ChartLegends -> Automatic]最大のカテゴリを強調するために"MaxCount"を用い,その他のすべての要素を単一の汎用グループにまとめるために "RemainderCategory"を用いる:
CategoricalHistogram[groupdata, <|"MaxCount" -> 2|>, ChartLegends -> Automatic]"MaxCount"で選択されたもとの要素を保持したまま,破棄されたすべての要素を単一の汎用グループに入れるために"RemainderCategory"を追加する:
CategoricalHistogram[groupdata, <|"MaxCount" -> 2, "RemainderCategory" -> "Others"|>, PlotLegends -> Automatic]Palmerペンギンのデータ集合におけるペンギンの数を,島ごとにグループ化して表示する:
tab = ResourceData["Sample Tabular Data: Palmer Penguins"];
data = GroupBy[tab, #sex&, Normal[#[All, "species"]]&];CategoricalHistogram[data, ChartLegends -> Automatic]kidneydata = ToTabular[ResourceData["Sample Data: Kidney Transplant"]];
CategoricalHistogram[kidneydata -> "Gender", ChartLegends -> Automatic]kidneydatabygenderandrace = GroupBy[kidneydata, #Gender&, Normal[#[All, "Race"]]&];
CategoricalHistogram[kidneydatabygenderandrace, ChartLegends -> Automatic]樹木調査のデータ集合から,樹木データを収集したユーザのカテゴリの種類を分析する:
NYCTrees = ResourceData["Sample Tabular Data: NYC Trees"];CategoricalHistogram[NYCTrees -> "user_type", BarSpacing -> 2]NYCTreesbyusertype = GroupBy[NYCTrees, #"user_type"&, Normal[#[All, "borough"]]&];CategoricalHistogram[NYCTreesbyusertype, BarSpacing -> {Automatic, 4}, PlotLegends -> Automatic]テキスト
Wolfram Research (2026), CategoricalHistogram, Wolfram言語関数, https://reference.wolfram.com/language/ref/CategoricalHistogram.html.
CMS
Wolfram Language. 2026. "CategoricalHistogram." Wolfram Language & System Documentation Center. Wolfram Research. https://reference.wolfram.com/language/ref/CategoricalHistogram.html.
APA
Wolfram Language. (2026). CategoricalHistogram. Wolfram Language & System Documentation Center. Retrieved from https://reference.wolfram.com/language/ref/CategoricalHistogram.html