CirculantGraph[n,j]
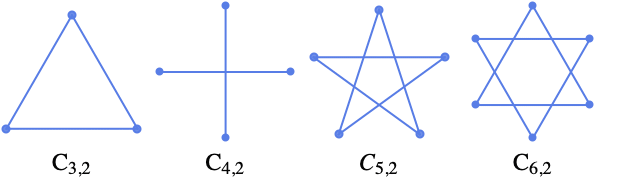
给出含有 n 个顶点和跳跃值 j 的循环图
.
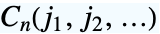
CirculantGraph[n,{j1,j2,…}]
给出含有 n 个顶点和跳跃值 j1, j2, …的循环图
.
CirculantGraph
CirculantGraph[n,j]
给出含有 n 个顶点和跳跃值 j 的循环图
.
CirculantGraph[n,{j1,j2,…}]
给出含有 n 个顶点和跳跃值 j1, j2, …的循环图

.
更多信息和选项
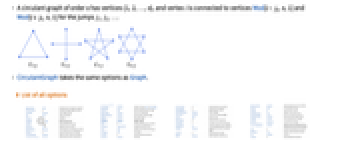
- n 阶循环图含有顶点 {1,2,…,n},并且根据跳跃值 j1、j2、…,顶点 i 与顶点 Mod[i-jk,n,1] 和Mod[i+jk,n,1] 相连通.
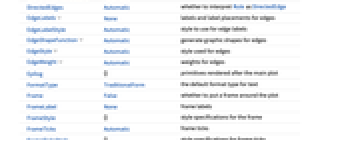
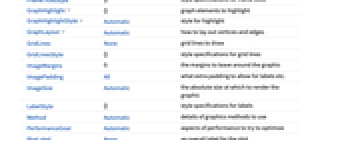
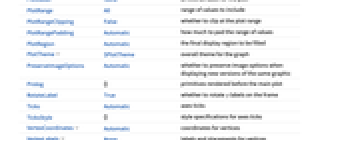
- CirculantGraph 具有和 Graph 相同的选项.
所有选项的列表
范例
打开所有单元 关闭所有单元基本范例 (2)
选项 (79)
AnnotationRules (2)
EdgeLabels (7)
CirculantGraph[5, 2, EdgeLabels -> {13 -> "Hello"}]el = EdgeList[CirculantGraph[5, 2]]CirculantGraph[5, 2, EdgeLabels -> Table[el[[i]] -> Subscript["e", i], {i, Length[el]}]]CirculantGraph[5, 2, EdgeLabels -> {24 -> [image], 14 -> [image], 35 -> [image]}]使用符号位置信息的 Placed 来控制沿着一条边的标签位置:
Table[CirculantGraph[5, 2, EdgeLabels -> {13 -> Placed["■■■", p]}, PlotLabel -> p], {p, {"Start", "Middle", "End"}}]Table[CirculantGraph[5, 2, EdgeLabels -> {13 -> Placed["■■■", p]}, PlotLabel -> p, BaselinePosition -> Bottom], {p, {0, 1 / 4, 1 / 3}}]Table[CirculantGraph[5, 2, EdgeLabels -> {13 -> Placed["■■■", {1 / 2, p}]}, PlotLabel -> p, BaselinePosition -> Bottom], {p, {{0, 0}, {1 / 2, 1 / 2}, {1, 1}}}]CirculantGraph[5, 2, EdgeLabels -> {31 -> Placed[{"lbl1", "lbl2"}, {"Start", "End"}]}]CirculantGraph[5, 2, EdgeLabels -> {31 -> Placed[{"lbl1", "lbl2", "lbl3"}, {"Start", "Middle", "End"}]}]通过 Tooltip 和 StatusArea 的值,使用自动标签:
CirculantGraph[5, 2, EdgeLabels -> Placed["Name", Tooltip]]CirculantGraph[5, 2, EdgeLabels -> Placed["Name", StatusArea]]EdgeShapeFunction (6)
获取 EdgeShapeFunction 的内置设置列表:
ResourceData["EdgeShapeFunction"]CirculantGraph[5, 2, EdgeShapeFunction -> "Line"]Table[CirculantGraph[5, 2, EdgeShapeFunction -> {{ef, "ArrowSize" -> 0.1}}, PlotLabel -> ef], {ef, {"BoxLine", "DiamondLine", "DotLine"}}]Table[CirculantGraph[5, 2, EdgeShapeFunction -> {{ef, "ArrowSize" -> 0.1}}, PlotLabel -> ef], {ef, ResourceData["EdgeShapeFunction", "FilledArrow"]}]Table[CirculantGraph[5, 2, EdgeShapeFunction -> {{ef, "ArrowSize" -> 0.1}}, PlotLabel -> ef], {ef, ResourceData["EdgeShapeFunction", "UnfilledArrow"]}]Table[CirculantGraph[5, 2, EdgeShapeFunction -> {{ef, "ArrowSize" -> 0.1}}, PlotLabel -> ef], {ef, ResourceData["EdgeShapeFunction", "CarvedArrow"]}]CirculantGraph[5, 2, EdgeShapeFunction -> {13 -> "DotLine"}]CirculantGraph[5, 2, EdgeShapeFunction -> {13 -> "BoxLine", "DotLine"}]ef[pts_List, e_] :=
Block[{s = 0.015, g = [image]}, {Arrowheads[{{s, 0.33, g}, {s, 0.67, g}}], Arrow[pts]}]CirculantGraph[5, 2, EdgeShapeFunction -> ef]EdgeShapeFunction 可以与 EdgeStyle 合起来使用:
CirculantGraph[5, 2, EdgeStyle -> Blue, EdgeShapeFunction -> (Line[#1]&)]EdgeShapeFunction 具有比 EdgeStyle 更高的优先级:
CirculantGraph[5, 2, EdgeStyle -> Blue, EdgeShapeFunction -> ({Red, Line[#1]}&)]EdgeStyle (2)
EdgeWeight (2)
CirculantGraph[5, 2, EdgeWeight -> RandomInteger[5, 5]]WeightedAdjacencyMatrix[%]//MatrixFormCirculantGraph[5, 2, EdgeWeight -> {a, b, c, d, e}]WeightedAdjacencyMatrix[%]//MatrixFormGraphHighlight (3)
CirculantGraph[5, 2, VertexSize -> Tiny, GraphHighlight -> {1}]CirculantGraph[5, 2, VertexSize -> Tiny, GraphHighlight -> {13}]CirculantGraph[5, 2, VertexSize -> Tiny, GraphHighlight -> {1, 2, 13, 14}]GraphHighlightStyle (2)
获取 GraphHighlightStyle 的默认设置列表:
ResourceData["GraphHighlightStyle"]使用 GraphHighlightStyle 的内置设置列表:
CirculantGraph[5, 2, GraphHighlight -> {1, 13}, VertexSize -> Small, GraphHighlightStyle -> #, PlotLabel -> #]& /@ Select[ResourceData["GraphHighlightStyle"], # =!= Automatic&]GraphLayout (5)
CirculantGraph[5, 2, GraphLayout -> Automatic]Table[CirculantGraph[20, 3, GraphLayout -> l, PlotLabel -> l], {l, {"CircularEmbedding", "SpiralEmbedding"}}]Table[CirculantGraph[20, 3, GraphLayout -> l, PlotLabel -> l], {l, {"SpringEmbedding", "SpringElectricalEmbedding", "HighDimensionalEmbedding"}}]VertexCoordinates 重载 GraphLayout 坐标:
{CirculantGraph[5, 2, GraphLayout -> "SpringElectricalEmbedding"],
CirculantGraph[5, 2, GraphLayout -> "SpringElectricalEmbedding", VertexCoordinates -> Table[{i, i}, {i, 0, 4}]]}通过一个布局算法,利用 AbsoluteOptions 提取计算所得的 VertexCoordinates:
CirculantGraph[5, 2]AbsoluteOptions[%, VertexCoordinates]PlotTheme (4)
Base Themes (2)
VertexCoordinates (3)
CirculantGraph[5, 2]通过 AbsoluteOptions 提取顶点坐标的结果:
AbsoluteOptions[%, VertexCoordinates]ellipseLayout[n_, {a_, b_}] := Table[{a Cos[2Pi / n u], b Sin[2Pi / n u]}, {u, 1, n}]Graphics[Point[ellipseLayout[20, {2, 1}]]]CirculantGraph[20, 2, VertexCoordinates -> ellipseLayout[20, {2, 1}]]VertexCoordinates 优先级高于 GraphLayout:
CirculantGraph[5, 2, VertexCoordinates -> Table[{i, i}, {i, 5}], GraphLayout -> "CircularEmbedding"]VertexLabels (13)
CirculantGraph[5, 2, VertexLabels -> "Name"]CirculantGraph[5, 2, VertexLabels -> {2 -> "one"}]CirculantGraph[5, 2, VertexLabels -> Table[i -> Subscript[v, i], {i, 5}]]CirculantGraph[5, 2, VertexLabels -> {1 -> [image], 2 -> [image], 3 -> [image]}]使用有符号化位置(包括外部位置)的 Placed 来控制标签的放置:
Table[CirculantGraph[5, 2, VertexSize -> 0.1, VertexShapeFunction -> "Square", VertexLabels -> Table[i -> Placed["■■■", p], {i, 5}], PlotLabel -> p, ImagePadding -> 20], {p, {Before, After, Below, Above}}]pl = {{Before, Below}, {After, Below}, {Before, Above}, {After, Above}};Table[CirculantGraph[5, 2, VertexSize -> 0.1, VertexShapeFunction -> "Square", ImagePadding -> 20, VertexLabels -> Table[i -> Placed["■■■", p], {i, 5}], PlotLabel -> p], {p, pl}]Table[CirculantGraph[5, 2, VertexSize -> 0.35, VertexLabels -> Table[i -> Placed["■■■", p], {i, 5}], VertexShapeFunction -> "Square", PlotLabel -> p], {p, {Left, Top, Right, Bottom}}]pl = {{Left, Bottom}, {Right, Bottom}, {Left, Top}, {Right, Top}};Table[CirculantGraph[5, 2, VertexSize -> 0.35, VertexShapeFunction -> "Square", VertexLabels -> Table[i -> Placed["■■■", p], {i, 5}], PlotLabel -> p], {p, pl}]Table[CirculantGraph[5, 2, VertexSize -> 0.35, VertexShapeFunction -> "Square", VertexLabels -> Table[i -> Placed[[image], p], {i, 5}], PlotLabel -> p, BaselinePosition -> Bottom], {p, {{0, 0}, {1 / 2, 1 / 2}, {1, 1}}}]Table[CirculantGraph[5, 2, VertexSize -> 0.35, VertexShapeFunction -> "Square", VertexLabels -> Table[i -> Placed[[image], {{1, 1}, p}], {i, 5}], PlotLabel -> p, BaselinePosition -> Bottom], {p, {{0, 0}, {1 / 2, 1 / 2}, {1, 1}}}]CirculantGraph[5, 2, VertexLabels -> {1 -> Placed[{"lbl1", "lbl2"}, {Above, Below}]}]CirculantGraph[5, 2, VertexLabels -> {1 -> Placed[{"lbl1", "lbl2", "lbl3", "lbl4"}, {Above, After, Below, Before}]}]使用 Placed 的参量控制包括 Tooltip 在内的格式化:
CirculantGraph[5, 2, VertexLabels -> Placed["Name", Tooltip]]或 StatusArea:
CirculantGraph[5, 2, VertexLabels -> Placed["Name", StatusArea]]rotateLabel[lab_] := Rotate[lab, 45Degree]CirculantGraph[5, 2, VertexLabels -> Table[i -> Placed["xxx", Below, rotateLabel], {i, 5}]]panelLabel[lab_] := Panel[lab, FrameMargins -> 0, Background -> Lighter[Yellow, 0.7]]CirculantGraph[5, 2, VertexLabels -> Table[i -> Placed["xxx", Center, panelLabel], {i, 5}]]hyperlinkLabel[lab_] := Hyperlink[lab, "http://www.wolfram.com"]CirculantGraph[5, 2, VertexLabels -> Table[i -> Placed["xxx", Center, hyperlinkLabel], {i, 5}]]VertexShape (5)
将任意 Graphics、Image 或者 Graphics3D 作为顶点形状使用:
Table[CirculantGraph[5, 2, VertexShape -> s, VertexSize -> Medium], {s, {[image], [image], [image]}}]CirculantGraph[5, 2, VertexShape -> {2 -> [image]}, VertexSize -> Medium]VertexShape 可以与 VertexSize 合起来使用:
Table[CirculantGraph[5, 2, VertexSize -> s, VertexShape -> [image], PlotLabel -> s], {s, {Small, Large}}]VertexShape 不受 VertexStyle 影响:
CirculantGraph[5, 2, VertexSize -> 0.2, VertexShape -> [image], VertexStyle -> Blue]VertexShapeFunction 具有比 VertexShape 更高的优先级:
CirculantGraph[5, 2, VertexSize -> 0.1, VertexShapeFunction -> "Square", VertexShape -> [image]]VertexShapeFunction (10)
获取 VertexShapeFunction 的内置设置列表:
ResourceData["VertexShapeFunction"]利用 VertexShapeFunction 在 "Basic" 集合中的内置设置:
ResourceData["VertexShapeFunction", "Basic"]Table[CirculantGraph[5, 2, VertexShapeFunction -> vf, VertexSize -> 0.2, PlotLabel -> vf], {vf, {"Triangle", "Square", "Rectangle", "Pentagon", "Hexagon", "Octagon"}}]Table[CirculantGraph[5, 2, VertexShapeFunction -> vf, VertexSize -> 0.2, PlotLabel -> vf], {vf, {"DownTrapezoid", "UpTrapezoid", "Parallelogram", "FiveDown", "Circle", "Diamond", "Star", "Capsule"}}]使用 VertexShapeFunction 在 "Rounded" 集合中的内置设置:
ResourceData["VertexShapeFunction", "Rounded"]Table[CirculantGraph[5, 2, VertexShapeFunction -> vf, VertexSize -> 0.2, PlotLabel -> vf], {vf, ResourceData["VertexShapeFunction", "Rounded"]}]使用 VertexShapeFunction 在 "Concave" 集合中的内置设置:
ResourceData["VertexShapeFunction", "Concave"]Table[CirculantGraph[5, 2, VertexShapeFunction -> vf, VertexSize -> 0.2, PlotLabel -> vf], {vf, ResourceData["VertexShapeFunction", "Concave"]}]CirculantGraph[5, 2, VertexShapeFunction -> { 1 -> "Square"}, VertexSize -> 0.2]CirculantGraph[5, 2, VertexShapeFunction -> { 1 -> "Square", "Triangle"}, VertexSize -> 0.2]CirculantGraph[5, 2, VertexShapeFunction -> (Inset[[image], #]&)]vf[{xc_, yc_}, name_, {w_, h_}] :=
Block[{xmin = xc - w, xmax = xc + w, ymin = yc - h, ymax = yc + h},
Polygon[{{xmin, ymin}, {xmax, ymax}, {xmin, ymax}, {xmax, ymin}}]
];CirculantGraph[5, 2, VertexShapeFunction -> vf, VertexSize -> 0.2]VertexShapeFunction 可以与 VertexStyle 合起来使用:
vf1[{xc_, yc_}, name_, {w_, h_}] := Rectangle[{xc - w, yc - h}, {xc + w, yc + h}]CirculantGraph[5, 2, VertexSize -> 0.2, VertexStyle -> Blue, VertexShapeFunction -> vf1]VertexShapeFunction 具有比 VertexStyle 更高的优先级:
vf2[{xc_, yc_}, name_, {w_, h_}] := {Red, Rectangle[{xc - w, yc - h}, {xc + w, yc + h}]}CirculantGraph[5, 2, VertexSize -> 0.2, VertexStyle -> Blue, VertexShapeFunction -> vf2]VertexShapeFunction 可以与 VertexSize 合起来使用:
CirculantGraph[5, 2, VertexShapeFunction -> "Star", VertexSize -> {1 -> Small, Medium}]VertexShapeFunction 具有比 VertexShape 更高的优先级:
CirculantGraph[5, 2, VertexSize -> 0.3, VertexShapeFunction -> "Star", VertexShape -> [image]]VertexSize (8)
CirculantGraph[5, 2, VertexSize -> Automatic]Table[CirculantGraph[5, 2, VertexSize -> s, PlotLabel -> s], {s, {Tiny, Small, Medium, Large}}]Table[CirculantGraph[5, 2, VertexSize -> s, PlotLabel -> s], {s, 0.1, 1, 0.3}]Table[CirculantGraph[5, 2, VertexSize -> {"Scaled", s}, PlotLabel -> {"Scaled", s}], {s, 0.1, 1, 0.3}]Table[CirculantGraph[5, 2, VertexSize -> s, PlotLabel -> s], {s, {{0.1, 0.2}, {0.2, 0.1}}}]CirculantGraph[5, 2, VertexSize -> {1 -> 0.2, 2 -> 0.3}]VertexSize 可以与 VertexShapeFunction 合起来使用:
Table[CirculantGraph[5, 2, VertexSize -> s, VertexShapeFunction -> "Square", PlotLabel -> s], {s, {0.05, 0.1, 0.2}}]VertexSize 可以与 VertexShape 合起来使用:
Table[CirculantGraph[5, 2, VertexSize -> s, VertexShape -> [image], PlotLabel -> s], {s, {0.1, 0.2, 0.4}}]VertexStyle (5)
Table[CirculantGraph[5, 2, VertexStyle -> style, VertexSize -> 0.2, PlotLabel -> style], {style, {Yellow, EdgeForm[Dashed]}}]CirculantGraph[5, 2, VertexStyle -> {1 -> Blue, 2 -> Red}, VertexSize -> 0.2]VertexShapeFunction 可以与 VertexStyle 合起来使用:
vf1[{xc_, yc_}, name_, {w_, h_}] := Rectangle[{xc - w, yc - h}, {xc + w, yc + h}]CirculantGraph[5, 2, VertexSize -> 0.2, VertexStyle -> Blue, VertexShapeFunction -> vf1]VertexShapeFunction 具有比 VertexStyle 更高的优先级:
vf2[{xc_, yc_}, name_, {w_, h_}] := {Red, Rectangle[{xc - w, yc - h}, {xc + w, yc + h}]}CirculantGraph[5, 2, VertexSize -> 0.2, VertexStyle -> Blue, VertexShapeFunction -> vf2]VertexStyle 可以与 BaseStyle 合起来使用:
CirculantGraph[5, 2, VertexStyle -> LightBlue, BaseStyle -> EdgeForm[Dotted], VertexSize -> 0.2]VertexStyle 具有比 BaseStyle 更高的优先级:
CirculantGraph[5, 2, VertexStyle -> LightBlue, BaseStyle -> Gray, VertexSize -> 0.2]VertexShape 不受 VertexStyle 影响:
CirculantGraph[5, 2, VertexSize -> 0.2, VertexShape -> [image], VertexStyle -> Blue]VertexWeight (2)
CirculantGraph[5, 2, VertexWeight -> {2, 3, 4, 5, 6}]AnnotationValue[{%, 1}, VertexWeight]CirculantGraph[5, 2, VertexWeight -> {a, b, c, d, e}]AnnotationValue[{%, 1}, VertexWeight]应用 (6)
循环图的 GraphCenter:
Table[HighlightGraph[#, GraphCenter[#]]&[CirculantGraph[i, 2, VertexSize -> Medium]], {i, 3, 6}]Table[HighlightGraph[#, GraphPeriphery[#]]&[CirculantGraph[i, 2, VertexSize -> Medium]], {i, 3, 6}]VertexEccentricity[CirculantGraph[5, 2], #]& /@ VertexList[CirculantGraph[5, 2]]FindVertexEccentricityPath[g_ ? UndirectedGraphQ, u_] /; MemberQ[VertexList[g], u] := Module[{d = GraphDistanceMatrix[g], posu, posv, vl = VertexList[g]}, posu = VertexIndex[g, u];
posv = First@First@Position[d[[posu]], Max[d[[posu]]]];
PathGraph[FindShortestPath[g, u, vl[[posv]]]]]Table[HighlightGraph[g = CirculantGraph[5, 2], FindVertexEccentricityPath[g, u]], {u, Range[4]}]Table[GraphRadius[CirculantGraph[i, 2]], {i, 3, 8}]FindRadiusPath[g_ ? UndirectedGraphQ] := Module[{c = First@GraphCenter[g], d, v, pos}, d = Table[GraphDistance[g, c, u], {u, VertexList[g]}];
pos = First@Position[d, Max[d]];
v = First@Part[VertexList[g], pos];
PathGraph[FindShortestPath[g, c, v]]]Table[HighlightGraph[#, FindRadiusPath[#]]&[CirculantGraph[i, 2, VertexSize -> Tiny]], {i, {3, 5, 7}}]Table[GraphDiameter[CirculantGraph[i, 2]], {i, 3, 8}]FindDiameterPath[g_ ? UndirectedGraphQ] := Module[{d = GraphDistanceMatrix[g], u, v, pos}, pos = First@Position[d, Max[d]];
{u, v} = Part[VertexList[g], pos];
PathGraph[FindShortestPath[g, u, v]]]Table[HighlightGraph[#, FindDiameterPath[#]]&[CirculantGraph[i, 2, VertexSize -> Tiny]], {i, {3, 5, 7}}]突出显示 CirculantGraph 的顶点度:
HighlightCentrality[g_, cc_] := HighlightGraph[g, Table[Style[VertexList[g][[i]], ColorData["TemperatureMap"][cc[[i]] / Max[cc]]], {i, VertexCount[g]}]];g = CirculantGraph[10, {2, 4}, VertexSize -> Large];HighlightCentrality[g, VertexDegree[g]]HighlightCentrality[g, ClosenessCentrality[g]]HighlightCentrality[g, EigenvectorCentrality[g]]属性和关系 (6)
CirculantGraph[n,j] 具有 n 个顶点:
VertexCount[CirculantGraph[n, j]]DiscretePlot[EdgeCount[CirculantGraph[n, 5]], {n, 3, 25}, AxesOrigin -> {0, 0}]VertexDegree[CirculantGraph[6, {1, 2, 3}]]{CirculantGraph[6, {1, 2, 3}], CompleteGraph[6]}{CirculantGraph[6, 1], CycleGraph[6]}AdjacencyMatrix[CirculantGraph[6, {3, 5}]]//MatrixPlot可能存在的问题 (1)
设置 DirectedEdges->True 不应用于 CirculantGraph:
CirculantGraph[7, {2, 3}, DirectedEdges -> True]相关指南
-
▪
- 图的构建与表示
文本
Wolfram Research (2010),CirculantGraph,Wolfram 语言函数,https://reference.wolfram.com/language/ref/CirculantGraph.html.
CMS
Wolfram 语言. 2010. "CirculantGraph." Wolfram 语言与系统参考资料中心. Wolfram Research. https://reference.wolfram.com/language/ref/CirculantGraph.html.
APA
Wolfram 语言. (2010). CirculantGraph. Wolfram 语言与系统参考资料中心. 追溯自 https://reference.wolfram.com/language/ref/CirculantGraph.html 年
BibTeX
@misc{reference.wolfram_2026_circulantgraph, author="Wolfram Research", title="{CirculantGraph}", year="2010", howpublished="\url{https://reference.wolfram.com/language/ref/CirculantGraph.html}", note=[Accessed: 16-September-2026]}
BibLaTeX
@online{reference.wolfram_2026_circulantgraph, organization={Wolfram Research}, title={CirculantGraph}, year={2010}, url={https://reference.wolfram.com/language/ref/CirculantGraph.html}, note=[Accessed: 16-September-2026]}