

ColorFunction
is an option for graphics functions that specifies a function to apply to determine colors of elements.
Details
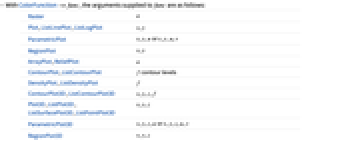
- With ColorFunction->func, the arguments supplied to func are as follows:
-
Raster a Plot,ListLinePlot,ListLogPlot x, y ParametricPlot x, y, u or x, y, u, v RegionPlot x, y ArrayPlot,ReliefPlot a ContourPlot,ListContourPlot f contour levels DensityPlot,ListDensityPlot f ContourPlot3D,ListContourPlot3D x, y, z, f Plot3D,ListPlot3D,ListSurfacePlot3D,ListPointPlot3D x, y, z ParametricPlot3D x, y, z, u or x, y, z, u, v RegionPlot3D x, y, z Image3D,Raster3D a - With the usual default setting ColorFunctionScaling->True, all arguments supplied to func are scaled to lie in the range 0 to 1.
- With ColorFunctionScaling->False, original unscaled values are used.
- ColorFunction->"name" is equivalent to ColorFunction->(ColorData["name"][#i]&) where the slot used is as follows: Plot, ListPlot, etc.: #2 (
 ); ArrayPlot, ReliefPlot: #1 (
 ); ContourPlot, DensityPlot, etc.: #1 (
 ); ContourPlot3D, etc.: #4 (
 ); Plot3D, etc.: #3 (
 ).
). - The list of possible color function names is given by ColorData["Gradients"].
- The function specified by ColorFunction must return color directives such as RGBColor and Hue or named colors such as Red and Blue.
- It can also return Opacity, as well as Glow and Specularity.
- Combinations of directives can be specified using Directive[g1,g2,…].
- In 3D graphics, ColorFunction by default specifies diffuse colors for surfaces.
- If an explicit setting is given for ColorRules, MeshShading, or ContourShading, it is used in preference to the setting for ColorFunction.
Examples
open all close allBasic Examples (5)
Properties & Relations (1)
Use predefined color gradients from ColorData:
Possible Issues (1)
By default, the arguments to ColorFunction are rescaled to be between 0 and 1:
Turn off ColorFunctionScaling to keep the original values:
Text
Wolfram Research (1991), ColorFunction, Wolfram Language function, https://reference.wolfram.com/language/ref/ColorFunction.html (updated 2012).
CMS
Wolfram Language. 1991. "ColorFunction." Wolfram Language & System Documentation Center. Wolfram Research. Last Modified 2012. https://reference.wolfram.com/language/ref/ColorFunction.html.
APA
Wolfram Language. (1991). ColorFunction. Wolfram Language & System Documentation Center. Retrieved from https://reference.wolfram.com/language/ref/ColorFunction.html