ExpressionGraph[expr]
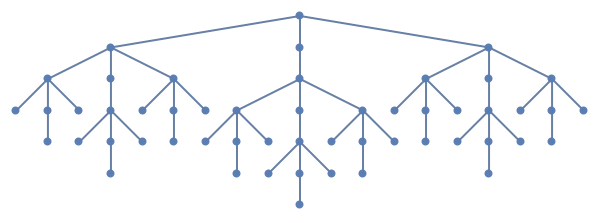
異なる深さの異なるレベルを持つ木グラフを与える.
ExpressionGraph[expr,n]
レベル n までの木グラフを与える.
ExpressionGraph[expr,n,form]
form にマッチする部分式が葉となっている木グラフを与える.
ExpressionGraph
ExpressionGraph[expr]
異なる深さの異なるレベルを持つ木グラフを与える.
ExpressionGraph[expr,n]
レベル n までの木グラフを与える.
ExpressionGraph[expr,n,form]
form にマッチする部分式が葉となっている木グラフを与える.
詳細とオプション
- ExpressionGraphはGraphオブジェクトを生成する.
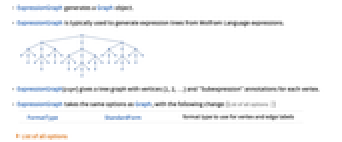
- ExpressionGraphは,Wolfram言語の式から式木を生成するために使われることが多い.
- ExpressionGraph[expr]は,頂点が{1,2,…}で各頂点に"Subexpression"の注釈が付いた木グラフを与える.
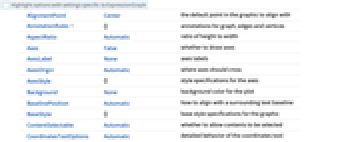
- ExpressionGraphはGraphと同じオプションを取る.以下の変更がある. [全オプションのリスト]
-
FormatType StandardForm 頂点と辺のラベルのフォーマットタイプ
全オプションのリスト
例題
すべて開く すべて閉じる例 (3)
ExpressionGraph[a + b ^ 2 + c ^ 3 + d]ExpressionGraph[Nest[{#, #}&, x, 4]]ExpressionGraph[Nest[{{#}, #, #}&, x, 4]]ExpressionGraph[[image], 2]スコープ (5)
ExpressionGraphはフォーマットされた記号式に使うことができる:
ExpressionGraph[E^n I π]ExpressionGraphは下付き文字付きの変数を含む式に使うことができる:
ExpressionGraph[Subscript[x, 1] + Subscript[x, 2]]ExpressionGraph[{1, {2, {3}}}]ExpressionGraph[[image]]ExpressionGraph[{1, {2, {3}}}, 2]VertexLabels->Automaticを使ってラベル付きのグラフを生成する:
ExpressionGraph[a + b ^ Cos[e + 1] + c ^ 3 + d + Cos[e], VertexLabels -> Automatic]form にマッチする部分式が葉になっている木グラフを与える:
ExpressionGraph[a + b ^ Cos[e + 1] + c ^ 3 + d + Cos[e], _Cos, VertexLabels -> Automatic]オプション (82)
AnnotationRules (3)
ExpressionGraph[a + b + c, AnnotationRules -> {1 -> {VertexLabels -> "hello"}}]ExpressionGraph[a + b + c, AnnotationRules -> {12 -> {EdgeLabels -> "hello"}}]ExpressionGraph[a + b + c, AnnotationRules -> {"GraphProperties" -> {"Message" -> "hello"}}]AnnotationValue[%, "Message"]DirectedEdges (1)
ExpressionGraph[a + b + c]DirectedEdges->Trueを使って有向グラフを生成する:
ExpressionGraph[a + b + c, DirectedEdges -> True]EdgeLabels (7)
ExpressionGraph[a + b, EdgeLabels -> {12 -> "Hello"}]el = EdgeList[ExpressionGraph[a + b]]ExpressionGraph[a + b, EdgeLabels -> Table[el[[i]] -> Subscript["e", i], {i, Length[el]}]]ExpressionGraph[a + b ^ 2, EdgeLabels -> {12 -> [image], 13 -> [image], 34 -> [image]}]Placedを記号位置と一緒に使って辺に沿ったラベルの置き方を制御する:
Table[ExpressionGraph[a + b, EdgeLabels -> {12 -> Placed["■■■", p]}, PlotLabel -> p], {p, {"Start", "Middle", "End"}}]Table[ExpressionGraph[a + b, EdgeLabels -> {12 -> Placed["■■■", p]}, PlotLabel -> p, BaselinePosition -> Bottom], {p, {0, 1 / 4, 1 / 3}}]Table[ExpressionGraph[a + b, EdgeLabels -> {12 -> Placed["■■■", {1 / 2, p}]}, PlotLabel -> p, BaselinePosition -> Bottom], {p, {{0, 0}, {1 / 2, 1 / 2}, {1, 1}}}]ExpressionGraph[a + b + c, EdgeLabels -> {12 -> Placed[{"lbl1", "lbl2"}, {"Start", "End"}]}]ExpressionGraph[a + b + c, EdgeLabels -> {12 -> Placed[{"lbl1", "lbl2", "lbl3"}, {"Start", "Middle", "End"}]}]TooltipとStatusAreaからの値で自動的にラベルを付ける:
ExpressionGraph[a + b + c, EdgeLabels -> Placed["Name", Tooltip]]ExpressionGraph[a + b + c, EdgeLabels -> Placed["Name", StatusArea]]EdgeShapeFunction (6)
EdgeShapeFunctionの組込み設定のリストを得る:
ResourceData["EdgeShapeFunction"]ExpressionGraph[a + b + c, EdgeShapeFunction -> "Line"]Table[ExpressionGraph[a + b + c, EdgeShapeFunction -> {{ef, "ArrowSize" -> 0.1}}, PlotLabel -> ef], {ef, {"BoxLine", "DiamondLine", "DotLine"}}]Table[ExpressionGraph[a + b + c, EdgeShapeFunction -> {{ef, "ArrowSize" -> 0.1}}, PlotLabel -> ef], {ef, ResourceData["EdgeShapeFunction", "FilledArrow"]}]Table[ExpressionGraph[a + b + c, EdgeShapeFunction -> {{ef, "ArrowSize" -> 0.1}}, PlotLabel -> ef], {ef, ResourceData["EdgeShapeFunction", "UnfilledArrow"]}]Table[ExpressionGraph[a + b + c, EdgeShapeFunction -> {{ef, "ArrowSize" -> 0.1}}, PlotLabel -> ef], {ef, ResourceData["EdgeShapeFunction", "CarvedArrow"]}]ExpressionGraph[a + b + c, EdgeShapeFunction -> {12 -> "DotLine"}]ExpressionGraph[a + b + c, EdgeShapeFunction -> {12 -> "BoxLine", "DotLine"}]ef[pts_List, e_] :=
Block[{s = 0.015, g = [image]}, {Arrowheads[{{s, 0.33, g}, {s, 0.67, g}}], Arrow[pts]}]ExpressionGraph[a + b + c, EdgeShapeFunction -> ef]EdgeShapeFunctionはEdgeStyleと組み合せることができる:
ExpressionGraph[a + b + c, EdgeStyle -> Blue, EdgeShapeFunction -> (Line[#1]&)]EdgeShapeFunctionはEdgeStyleより優先順位が高い:
ExpressionGraph[a + b + c, EdgeStyle -> Blue, EdgeShapeFunction -> ({Red, Line[#1]}&)]EdgeStyle (2)
EdgeWeight (3)
ExpressionGraph[a + b + c, EdgeWeight -> RandomInteger[5, 2]]WeightedAdjacencyMatrix[%]//MatrixFormExpressionGraph[a + b + c, EdgeWeight -> {a, b}]WeightedAdjacencyMatrix[%]//MatrixFormExpressionGraph[a + b + c, EdgeWeight -> {12 -> 2, 13 -> 4}]AnnotationValue[{%, 12}, EdgeWeight]GraphHighlight (3)
ExpressionGraph[a + b + c, VertexSize -> Tiny, GraphHighlight -> {1}]ExpressionGraph[a + b + c, VertexSize -> Tiny, GraphHighlight -> {13}]ExpressionGraph[a + b + 1, VertexSize -> Tiny, GraphHighlight -> {1, 2, 12, 13}]GraphHighlightStyle (2)
GraphHighlightStyleの組込み設定のリストを得る:
ResourceData["GraphHighlightStyle"]GraphHighlightStyleの組込み設定を使う:
ExpressionGraph[a + b + c, GraphHighlight -> {1, 13}, VertexSize -> Small, GraphHighlightStyle -> #, PlotLabel -> #]& /@ Select[ResourceData["GraphHighlightStyle"], # =!= Automatic&]GraphLayout (5)
ExpressionGraph[a + b + c, GraphLayout -> Automatic]Table[ExpressionGraph[a + b ^ 2, GraphLayout -> l, PlotLabel -> Style[l, 10]], {l, {"CircularEmbedding", "SpiralEmbedding"}}]Table[ExpressionGraph[a + b ^ 2 + c ^ 3 + d, GraphLayout -> l, PlotLabel -> Style[l, 10]], {l, {"SpringEmbedding", "SpringElectricalEmbedding", "HighDimensionalEmbedding"}}]VertexCoordinatesはGraphLayout座標を無効にする:
{ExpressionGraph[a + b + c, GraphLayout -> "SpringElectricalEmbedding"],
ExpressionGraph[a + b + c, GraphLayout -> "SpringElectricalEmbedding", VertexCoordinates -> Table[{i, i}, {i, 0, 3}]]}AbsoluteOptionsを使ってレイアウトアルゴリズムで計算されたVertexCoordinatesを抽出する:
ExpressionGraph[a + b + c]AbsoluteOptions[%, VertexCoordinates]PlotTheme (4)
基本テーマ (2)
VertexCoordinates (2)
ExpressionGraph[a + b + c]AbsoluteOptionsを使って結果の頂点座標を抽出する:
AbsoluteOptions[%, VertexCoordinates]ellipseLayout[n_, {a_, b_}] := Table[{a Cos[2Pi / n u], b Sin[2Pi / n u]}, {u, 1, n}]Graphics[Point[ellipseLayout[29, {2, 1}]]]ExpressionGraph[a + b ^ 2 + c ^ 3 + d, VertexCoordinates -> ellipseLayout[9, {2, 1}]]VertexLabels (13)
ExpressionGraph[a + b + c, VertexLabels -> "Name"]ExpressionGraph[a + b + c, VertexLabels -> {1 -> "one"}]ExpressionGraph[a + b + c, VertexLabels -> Table[i -> Subscript[v, i], {i, 3}]]ExpressionGraph[a + b + c, VertexLabels -> {1 -> **[image]**, 2 -> [image], 3 -> [image]}]Placedを記号位置と一緒に使って外側位置を含むラベルの置き方を制御する:
Table[ExpressionGraph[a + b + c, VertexSize -> 0.1, VertexShapeFunction -> "Square", VertexLabels -> Table[i -> Placed["■■■", p], {i, 4}], PlotLabel -> p, ImagePadding -> 20], {p, {Before, After, Below, Above}}]pl = {{Before, Below}, {After, Below}, {Before, Above}, {After, Above}};Table[ExpressionGraph[a + b + c, VertexSize -> 0.1, VertexShapeFunction -> "Square", ImagePadding -> 20, VertexLabels -> Table[i -> Placed["■■■", p], {i, 4}], PlotLabel -> p], {p, pl}]Table[ExpressionGraph[a + b + c, VertexSize -> 0.25, VertexLabels -> Table[i -> Placed["■■■", p], {i, 4}], VertexShapeFunction -> "Square", PlotLabel -> p], {p, {Left, Top, Right, Bottom}}]pl = {{Left, Bottom}, {Right, Bottom}, {Left, Top}, {Right, Top}};Table[ExpressionGraph[a + b + c, VertexSize -> 0.25, VertexShapeFunction -> "Square", VertexLabels -> Table[i -> Placed["■■■", p], {i, 4}], PlotLabel -> p], {p, pl}]Table[ExpressionGraph[a + b + c, VertexSize -> 0.25, VertexShapeFunction -> "Square", VertexLabels -> Table[i -> Placed[[image], p], {i, 4}], PlotLabel -> p, BaselinePosition -> Bottom], {p, {{0, 0}, {1 / 2, 1 / 2}, {1, 1}}}]すべてのラベルを頂点の右上コーナー位置に置き,ラベル内の座標を変化させる:
Table[ExpressionGraph[a + b + c, VertexSize -> 0.35, VertexShapeFunction -> "Square", VertexLabels -> Table[i -> Placed[[image], {{1, 1}, p}], {i, 4}], PlotLabel -> p, BaselinePosition -> Bottom], {p, {{0, 0}, {1 / 2, 1 / 2}, {1, 1}}}]ExpressionGraph[a + b + c, VertexLabels -> {1 -> Placed[{"lbl1", "lbl2"}, {Above, Below}]}]ExpressionGraph[a + b + c, VertexLabels -> {1 -> Placed[{"lbl1", "lbl2", "lbl3", "lbl4"}, {Above, After, Below, Before}]}]Placedの引数を使ってTooltipを含むフォーマットを制御する:
ExpressionGraph[a + b + c, VertexLabels -> Placed["Name", Tooltip]]あるいはStatusAreaを含むフォーマットを制御する:
ExpressionGraph[a + b + c, VertexLabels -> Placed["Name", StatusArea]]rotateLabel[lab_] := Rotate[lab, 45Degree]ExpressionGraph[a + b + c, VertexLabels -> Table[i -> Placed["xxx", Below, rotateLabel], {i, 4}]]panelLabel[lab_] := Panel[lab, FrameMargins -> 0, Background -> StandardBlue]ExpressionGraph[a + b + c, VertexLabels -> Table[i -> Placed["xxx", Center, panelLabel], {i, 4}]]hyperlinkLabel[lab_] := Hyperlink[lab, "http://www.wolfram.com"]ExpressionGraph[a + b + c, VertexLabels -> Table[i -> Placed["xxx", Center, hyperlinkLabel], {i, 4}]]VertexShape (5)
Graphics,ImageあるいはGraphics3Dを頂点の形に使う:
Table[ExpressionGraph[a + b + c, VertexShape -> s, VertexSize -> Medium], {s, {[image], [image], [image]}}]ExpressionGraph[a + b + c, VertexShape -> {2 -> [image]}, VertexSize -> Small]VertexShapeはVertexSizeと組み合せることができる:
Table[ExpressionGraph[a + b + c, VertexSize -> s, VertexShape -> [image], PlotLabel -> s], {s, {Small, Large}}]VertexShapeはVertexStyleの影響を受けない:
ExpressionGraph[a + b + c, VertexSize -> 0.2, VertexShape -> [image], VertexStyle -> Blue]VertexShapeFunctionはVertexShapeより優先順位が高い:
ExpressionGraph[a + b + c, VertexSize -> 0.1, VertexShapeFunction -> "Square", VertexShape -> [image]]VertexShapeFunction (10)
組込みのVertexShapeFunctionコレクションのリストを得る:
ResourceData["VertexShapeFunction"]"Basic"コレクションのVertexShapeFunctionの組込み設定を使う:
ResourceData["VertexShapeFunction", "Basic"]Table[ExpressionGraph[a + b + c, VertexShapeFunction -> vf, VertexSize -> 0.2, PlotLabel -> vf], {vf, {"Triangle", "Square", "Rectangle", "Pentagon", "Hexagon", "Octagon"}}]Table[ExpressionGraph[a + b + c, VertexShapeFunction -> vf, VertexSize -> 0.2, PlotLabel -> vf], {vf, {"DownTrapezoid", "UpTrapezoid", "Parallelogram", "FiveDown", "Circle", "Diamond", "Star", "Capsule"}}]"Rounded"コレクションのVertexShapeFunctionの組込み設定を使う:
ResourceData["VertexShapeFunction", "Rounded"]Table[ExpressionGraph[a + b + c, VertexShapeFunction -> vf, VertexSize -> 0.2, PlotLabel -> vf], {vf, ResourceData["VertexShapeFunction", "Rounded"]}]"Concave"コレクションのVertexShapeFunctionの組込み設定を使う:
ResourceData["VertexShapeFunction", "Concave"]Table[ExpressionGraph[a + b + c, VertexShapeFunction -> vf, VertexSize -> 0.2, PlotLabel -> vf], {vf, ResourceData["VertexShapeFunction", "Concave"]}]ExpressionGraph[a + b + c, VertexShapeFunction -> { 1 -> "Square"}, VertexSize -> 0.2]ExpressionGraph[a + b + c, VertexShapeFunction -> { 1 -> "Square", "Triangle"}, VertexSize -> 0.2]ExpressionGraph[a + b + c, VertexShapeFunction -> (Inset[[image], #]&)]vf[{xc_, yc_}, name_, {w_, h_}] :=
Block[{xmin = xc - w, xmax = xc + w, ymin = yc - h, ymax = yc + h},
Polygon[{{xmin, ymin}, {xmax, ymax}, {xmin, ymax}, {xmax, ymin}}]
];ExpressionGraph[a + b + c, VertexShapeFunction -> vf, VertexSize -> 0.2]VertexShapeFunctionはVertexStyleと組み合せることができる:
vf1[{xc_, yc_}, name_, {w_, h_}] := Rectangle[{xc - w, yc - h}, {xc + w, yc + h}]ExpressionGraph[a + b + c, VertexSize -> 0.2, VertexStyle -> Blue, VertexShapeFunction -> vf1]VertexShapeFunctionはVertexStyleより優先順位が高い:
vf2[{xc_, yc_}, name_, {w_, h_}] := {Red, Rectangle[{xc - w, yc - h}, {xc + w, yc + h}]}ExpressionGraph[a + b + c, VertexSize -> 0.2, VertexStyle -> Blue, VertexShapeFunction -> vf2]VertexShapeFunctionはVertexSizeと組み合せることができる:
ExpressionGraph[a + b + c, VertexShapeFunction -> "Star", VertexSize -> {1 -> Small, Medium}]VertexShapeFunctionはVertexShapeより優先順位が高い:
ExpressionGraph[a + b + c, VertexSize -> 0.3, VertexShapeFunction -> "Star", VertexShape -> [image]]VertexSize (8)
ExpressionGraph[a + b + c, VertexSize -> Automatic]Table[ExpressionGraph[a + b + c, VertexSize -> s, PlotLabel -> s], {s, {Tiny, Small, Medium, Large}}]Table[ExpressionGraph[a + b + c, VertexSize -> s, PlotLabel -> s], {s, 0.1, 1, 0.3}]Table[ExpressionGraph[a + b + c, VertexSize -> {"Scaled", s}, PlotLabel -> {"Scaled", s}], {s, 0.1, 1, 0.3}]Table[ExpressionGraph[a + b + c, VertexSize -> s, PlotLabel -> s], {s, {{0.1, 0.2}, {0.2, 0.1}}}]ExpressionGraph[a + b + c, VertexSize -> {1 -> 0.2, 2 -> 0.3}]VertexSizeはVertexShapeFunctionと組み合せることができる:
Table[ExpressionGraph[a + b + c, VertexSize -> s, VertexShapeFunction -> "Square", PlotLabel -> s], {s, {0.05, 0.1, 0.2}}]VertexSizeはVertexShapeと組み合せることができる:
Table[ExpressionGraph[a + b + c, VertexSize -> s, VertexShape -> [image], PlotLabel -> s], {s, {0.1, 0.2, 0.4}}]VertexStyle (5)
Table[ExpressionGraph[a + b + c, VertexStyle -> style, VertexSize -> 0.3], {style, {Yellow, EdgeForm[Dashed]}}]ExpressionGraph[a + b + c, VertexStyle -> {1 -> Blue, 2 -> Red}, VertexSize -> 0.2]VertexShapeFunctionはVertexStyleと組み合せることができる:
vf1[{xc_, yc_}, name_, {w_, h_}] := Rectangle[{xc - w, yc - h}, {xc + w, yc + h}]ExpressionGraph[a + b + c, VertexSize -> 0.2, VertexStyle -> Blue, VertexShapeFunction -> vf1]VertexShapeFunctionはVertexStyleより優先順位が高い:
vf2[{xc_, yc_}, name_, {w_, h_}] := {Red, Rectangle[{xc - w, yc - h}, {xc + w, yc + h}]}ExpressionGraph[a + b + c, VertexSize -> 0.2, VertexStyle -> Blue, VertexShapeFunction -> vf2]VertexStyleはBaseStyleと組み合せることができる:
ExpressionGraph[a + b + c, VertexStyle -> LightBlue, BaseStyle -> EdgeForm[Dotted], VertexSize -> 0.2]VertexStyleはBaseStyleより優先順位が高い:
ExpressionGraph[a + b + c, VertexStyle -> LightBlue, BaseStyle -> Gray, VertexSize -> 0.2]VertexShapeはVertexStyleの影響を受けない:
ExpressionGraph[a + b + c, VertexSize -> 0.2, VertexShape -> [image], VertexStyle -> Blue]VertexWeight (3)
ExpressionGraph[a + b + c, VertexWeight -> {2, 3, 4, 5}]AnnotationValue[{%, 1}, VertexWeight]ExpressionGraph[a + b + c, VertexWeight -> {1 -> 2}]AnnotationValue[{%, 1}, VertexWeight]ExpressionGraph[a + b + c, VertexWeight -> {a, b, c, d}]AnnotationValue[{%, 1}, VertexWeight]アプリケーション (2)
特性と関係 (5)
VertexCountとEdgeCountを使って辺と頂点を数える:
g = ExpressionGraph[a + b ^ 2 + c]{VertexCount[g], EdgeCount[g]}VertexListとEdgeListを使って頂点と辺を標準的な順序で列挙する:
g = ExpressionGraph[a + b ^ 2 + c]{VertexList[g], EdgeList[g]}グラフからAdjacencyMatrixを計算する:
g = ExpressionGraph[Rectangle[]]AdjacencyMatrix[g]//MatrixFormFullFormはExpressionGraphに似た線形の式を与える:
FullForm[1 / (a + b) * x ^ 2]ExpressionGraph[1 / (a + b) * x ^ 2, VertexLabels -> Automatic]TreeFormを使って木グラフをプロットする:
TreeForm[1 / (a + b) * x ^ 2]考えられる問題 (1)
ExpressionGraph[expr]は評価された式 expr に使うことができる:
ExpressionGraph[1 + 1, VertexLabels -> Automatic]ExpressionGraph[Unevaluated[1 + 1], VertexLabels -> Automatic]関連するガイド
テキスト
Wolfram Research (2020), ExpressionGraph, Wolfram言語関数, https://reference.wolfram.com/language/ref/ExpressionGraph.html.
CMS
Wolfram Language. 2020. "ExpressionGraph." Wolfram Language & System Documentation Center. Wolfram Research. https://reference.wolfram.com/language/ref/ExpressionGraph.html.
APA
Wolfram Language. (2020). ExpressionGraph. Wolfram Language & System Documentation Center. Retrieved from https://reference.wolfram.com/language/ref/ExpressionGraph.html
BibTeX
@misc{reference.wolfram_2026_expressiongraph, author="Wolfram Research", title="{ExpressionGraph}", year="2020", howpublished="\url{https://reference.wolfram.com/language/ref/ExpressionGraph.html}", note=[Accessed: 10-September-2026]}
BibLaTeX
@online{reference.wolfram_2026_expressiongraph, organization={Wolfram Research}, title={ExpressionGraph}, year={2020}, url={https://reference.wolfram.com/language/ref/ExpressionGraph.html}, note=[Accessed: 10-September-2026]}