


DeBruijnGraph
DeBruijnGraph[m,n]
gives the n-dimensional De Bruijn graph with m symbols.
DeBruijnGraph[m,n,type]
gives the De Bruijn graph with connectivity given by type.
Details and Options
- DeBruijnGraph[m,n] has mn vertices, consisting of all length-n sequences of m symbols. Given two vertices v={s1,…,sn} and
 ={t1,…,tn}, there is an edge from v to
  , provided s2==t1, s3==t2, …, sn==tn-1.
 - DeBruijnGraph[m,n,type] specifies different connectivity types. The following types can be given:
-
"Noncyclic" ⩵t_(1)") , …,
, …, ⩵t_(n-1)")
"LeftShift" ⩵t_(n)") , s2t1, …, sn
, s2t1, …, sn ")
"RightShift" ") , …,
, …, ⩵t_(n)") ,
, ⩵t_(1)")
- DeBruijnGraph[…] is a directed graph.
- DeBruijnGraph takes the same options as Graph.
List of all options
Examples
open all close allBasic Examples (3)
The first few De Bruijn graphs with two symbols and different dimensions:
{DeBruijnGraph[2, 2], DeBruijnGraph[2, 3]}De Bruijn graphs with different numbers of symbols in dimension two:
{DeBruijnGraph[2, 2], DeBruijnGraph[3, 2]}De Bruijn graphs with different connectivity types:
Table[DeBruijnGraph[2, 3, type, PlotLabel -> type, BaselinePosition -> Top], {type, {"Noncyclic", "LeftShift", "RightShift" }}]Options (79)
AnnotationRules (2)
EdgeLabels (7)
DeBruijnGraph[2, 2, EdgeLabels -> {12 -> "Hello"}]el = EdgeList[DeBruijnGraph[2, 2]]DeBruijnGraph[2, 2, EdgeLabels -> Table[el[[i]] -> Subscript["e", i], {i, Length[el]}]]Use any expression as a label:
DeBruijnGraph[2, 2, EdgeLabels -> {12 -> [image], 23 -> [image], 31 -> [image]}]Use Placed with symbolic locations to control label placement along an edge:
Table[DeBruijnGraph[2, 2, EdgeLabels -> {23 -> Placed["■■■", p]}, PlotLabel -> p], {p, {"Start", "Middle", "End"}}]Use explicit coordinates to place labels:
Table[DeBruijnGraph[2, 2, EdgeLabels -> {23 -> Placed["■■■", p]}, PlotLabel -> p, BaselinePosition -> Bottom], {p, {0, 1 / 4, 1 / 3}}]Vary positions within the label:
Table[DeBruijnGraph[2, 2, EdgeLabels -> {23 -> Placed["■■■", {1 / 2, p}]}, PlotLabel -> p, BaselinePosition -> Bottom], {p, {{0, 0}, {1 / 2, 1 / 2}, {1, 1}}}]DeBruijnGraph[2, 2, EdgeLabels -> {31 -> Placed[{"lbl1", "lbl2"}, {"Start", "End"}]}]DeBruijnGraph[2, 2, EdgeLabels -> {31 -> Placed[{"lbl1", "lbl2", "lbl3"}, {"Start", "Middle", "End"}]}]Use automatic labeling by values through Tooltip and StatusArea:
DeBruijnGraph[2, 2, EdgeLabels -> Placed["Name", Tooltip]]DeBruijnGraph[2, 2, EdgeLabels -> Placed["Name", StatusArea]]EdgeShapeFunction (6)
Get a list of built-in settings for EdgeShapeFunction:
ResourceData["EdgeShapeFunction"]Undirected edges including the basic line:
DeBruijnGraph[2, 2, EdgeShapeFunction -> "Line"]Lines with different glyphs on the edges:
Table[DeBruijnGraph[2, 2, EdgeShapeFunction -> {{ef, "ArrowSize" -> 0.1}}, PlotLabel -> ef], {ef, {"BoxLine", "DiamondLine", "DotLine"}}]Directed edges including solid arrows:
Table[DeBruijnGraph[2, 2, EdgeShapeFunction -> {{ef, "ArrowSize" -> 0.1}}, PlotLabel -> ef], {ef, ResourceData["EdgeShapeFunction", "FilledArrow"]}]Table[DeBruijnGraph[2, 2, EdgeShapeFunction -> {{ef, "ArrowSize" -> 0.1}}, PlotLabel -> ef], {ef, ResourceData["EdgeShapeFunction", "UnfilledArrow"]}]Table[DeBruijnGraph[2, 2, EdgeShapeFunction -> {{ef, "ArrowSize" -> 0.1}}, PlotLabel -> ef], {ef, ResourceData["EdgeShapeFunction", "CarvedArrow"]}]Specify an edge function for an individual edge:
DeBruijnGraph[2, 2, EdgeShapeFunction -> {12 -> "CarvedArrow"}]Combine with a different default edge function:
DeBruijnGraph[2, 2, EdgeShapeFunction -> {12 -> "FilledArcArrow", "CarvedArrow"}]Draw edges by running a program:
ef[pts_List, e_] :=
Block[{s = 0.015, g = [image]}, {Arrowheads[{{s, 0.33, g}, {s, 0.67, g}}], Arrow[pts]}]DeBruijnGraph[2, 2, EdgeShapeFunction -> ef]EdgeShapeFunction can be combined with EdgeStyle:
DeBruijnGraph[2, 2, EdgeStyle -> Blue, EdgeShapeFunction -> (Line[#1]&)]EdgeShapeFunction has higher priority than EdgeStyle:
DeBruijnGraph[2, 2, EdgeStyle -> Blue, EdgeShapeFunction -> ({Red, Line[#1]}&)]EdgeStyle (2)
EdgeWeight (2)
Specify a weight for all edges:
DeBruijnGraph[2, 2, EdgeWeight -> RandomInteger[5, 8]]WeightedAdjacencyMatrix[%]//MatrixFormUse any numeric expression as a weight:
DeBruijnGraph[2, 2, EdgeWeight -> {a, b, c, d, e, f, g, h}]WeightedAdjacencyMatrix[%]//MatrixFormGraphHighlight (3)
DeBruijnGraph[2, 2, VertexSize -> Tiny, GraphHighlight -> {1}]DeBruijnGraph[2, 2, VertexSize -> Tiny, GraphHighlight -> {23}]DeBruijnGraph[2, 2, VertexSize -> Tiny, GraphHighlight -> {1, 2, 23, 24}]GraphHighlightStyle (2)
Get a list of built-in settings for GraphHighlightStyle:
ResourceData["GraphHighlightStyle"]Use built-in settings for GraphHighlightStyle:
DeBruijnGraph[2, 2, GraphHighlight -> {1, 23}, VertexSize -> Small, GraphHighlightStyle -> #, PlotLabel -> #]& /@ Select[ResourceData["GraphHighlightStyle"], # =!= Automatic&]GraphLayout (5)
By default, the layout is chosen automatically:
DeBruijnGraph[2, 2, GraphLayout -> Automatic]Specify layouts on special curves:
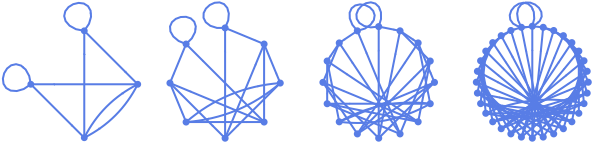
Table[DeBruijnGraph[5, 2, GraphLayout -> l, PlotLabel -> l], {l, {"CircularEmbedding", "SpiralEmbedding"}}]Specify layouts that satisfy optimality criteria:
Table[DeBruijnGraph[5, 2, GraphLayout -> l, PlotLabel -> l], {l, {"SpringEmbedding", "SpringElectricalEmbedding", "HighDimensionalEmbedding"}}]VertexCoordinates overrides GraphLayout coordinates:
{DeBruijnGraph[2, 2, GraphLayout -> "SpringElectricalEmbedding"],
	DeBruijnGraph[2, 2, GraphLayout -> "SpringElectricalEmbedding", VertexCoordinates -> Table[{i, i}, {i, 0, 3}]]}
Use AbsoluteOptions to extract VertexCoordinates computed using a layout algorithm:
DeBruijnGraph[2, 2]AbsoluteOptions[%, VertexCoordinates]PlotTheme (4)
Base Themes (2)
VertexCoordinates (3)
By default, any vertex coordinates are computed automatically:
DeBruijnGraph[2, 2]Extract the resulting vertex coordinates using AbsoluteOptions:
AbsoluteOptions[%, VertexCoordinates]Specify a layout function along an ellipse:
ellipseLayout[n_, {a_, b_}] := Table[{a Cos[2Pi / n u], b Sin[2Pi / n u]}, {u, 1, n}]Graphics[Point[ellipseLayout[20, {2, 1}]]]Use it to generate vertex coordinates for a graph:
DeBruijnGraph[4, 2, VertexCoordinates -> ellipseLayout[16, {2, 1}]]VertexCoordinates has higher priority than GraphLayout:
DeBruijnGraph[2, 2, VertexCoordinates -> Table[{i, i}, {i, 4}], GraphLayout -> "CircularEmbedding"]VertexLabels (13)
DeBruijnGraph[2, 2, VertexLabels -> "Name"]DeBruijnGraph[2, 2, VertexLabels -> {2 -> "one"}]DeBruijnGraph[2, 2, VertexLabels -> Table[i -> Subscript[v, i], {i, 4}]]Use any expression as a label:
DeBruijnGraph[2, 2, VertexLabels -> {1 -> [image], 2 -> [image], 3 -> [image]}, ImagePadding -> 20]Use Placed with symbolic locations to control label placement, including outside positions:
Table[DeBruijnGraph[2, 2, VertexSize -> 0.1, VertexShapeFunction -> "Square", VertexLabels -> Table[i -> Placed["■■■", p], {i, 4}], PlotLabel -> p, ImagePadding -> 20], {p, {Before, After, Below, Above}}]Symbolic outside corner positions:
pl = {{Before, Below}, {After, Below}, {Before, Above}, {After, Above}};Table[DeBruijnGraph[2, 2, VertexSize -> 0.1, VertexShapeFunction -> "Square", ImagePadding -> 20, VertexLabels -> Table[i -> Placed["■■■", p], {i, 4}], PlotLabel -> p], {p, pl}]Table[DeBruijnGraph[2, 2, VertexSize -> 0.35, VertexLabels -> Table[i -> Placed["■■■", p], {i, 4}], VertexShapeFunction -> "Square", PlotLabel -> p], {p, {Left, Top, Right, Bottom}}]Symbolic inside corner positions:
pl = {{Left, Bottom}, {Right, Bottom}, {Left, Top}, {Right, Top}};Table[DeBruijnGraph[2, 2, VertexSize -> 0.35, VertexShapeFunction -> "Square", VertexLabels -> Table[i -> Placed["■■■", p], {i, 4}], PlotLabel -> p], {p, pl}]Use explicit coordinates to place the center of labels:
Table[DeBruijnGraph[2, 2, VertexSize -> 0.35, VertexShapeFunction -> "Square", VertexLabels -> Table[i -> Placed[[image], p], {i, 4}], PlotLabel -> p, BaselinePosition -> Bottom], {p, {{0, 0}, {1 / 2, 1 / 2}, {1, 1}}}]Place all labels at the upper-right corner of the vertex and vary the coordinates within the label:
Table[DeBruijnGraph[2, 2, VertexSize -> 0.35, VertexShapeFunction -> "Square", VertexLabels -> Table[i -> Placed[[image], {{1, 1}, p}], {i, 4}], PlotLabel -> p, BaselinePosition -> Bottom], {p, {{0, 0}, {1 / 2, 1 / 2}, {1, 1}}}]DeBruijnGraph[2, 2, VertexLabels -> {1 -> Placed[{"lbl1", "lbl2"}, {Above, Below}]}]Any number of labels can be used:
DeBruijnGraph[2, 2, VertexLabels -> {1 -> Placed[{"lbl1", "lbl2", "lbl3", "lbl4"}, {Above, After, Below, Before}]}]Use the argument to Placed to control formatting including Tooltip:
DeBruijnGraph[2, 2, VertexLabels -> Placed["Name", Tooltip]]Or StatusArea:
DeBruijnGraph[2, 2, VertexLabels -> Placed["Name", StatusArea]]Use more elaborate formatting functions:
rotateLabel[lab_] := Rotate[lab, 45Degree]DeBruijnGraph[2, 2, VertexLabels -> Table[i -> Placed["xxx", Below, rotateLabel], {i, 4}]]panelLabel[lab_] := Panel[lab, FrameMargins -> 0, Background -> StandardBlue]DeBruijnGraph[2, 2, VertexLabels -> Table[i -> Placed["xxx", Center, panelLabel], {i, 4}]]hyperlinkLabel[lab_] := Hyperlink[lab, "http://www.wolfram.com"]DeBruijnGraph[2, 2, VertexLabels -> Table[i -> Placed["xxx", Center, hyperlinkLabel], {i, 4}]]VertexShape (5)
Use any Graphics, Image, or Graphics3D as a vertex shape:
Table[DeBruijnGraph[2, 2, VertexShape -> s, VertexSize -> Medium], {s, {[image], [image], [image]}}]Specify vertex shapes for individual vertices:
DeBruijnGraph[2, 2, VertexShape -> {2 -> [image]}, VertexSize -> Tiny]VertexShape can be combined with VertexSize:
Table[DeBruijnGraph[2, 2, VertexSize -> s, VertexShape -> [image], PlotLabel -> s], {s, {Small, Large}}]VertexShape is not affected by VertexStyle:
DeBruijnGraph[2, 2, VertexSize -> 0.3, VertexShape -> [image], VertexStyle -> Blue]VertexShapeFunction has higher priority than VertexShape:
DeBruijnGraph[2, 2, VertexSize -> 0.2, VertexShapeFunction -> "Square", VertexShape -> [image]]VertexShapeFunction (10)
Get a list of built-in collections for VertexShapeFunction:
ResourceData["VertexShapeFunction"]Use built-in settings for VertexShapeFunction in the "Basic" collection:
ResourceData["VertexShapeFunction", "Basic"]Table[DeBruijnGraph[2, 2, VertexShapeFunction -> vf, VertexSize -> 0.2, PlotLabel -> vf], {vf, {"Triangle", "Square", "Rectangle", "Pentagon", "Hexagon", "Octagon"}}]Table[DeBruijnGraph[2, 2, VertexShapeFunction -> vf, VertexSize -> 0.2, PlotLabel -> vf], {vf, {"DownTrapezoid", "UpTrapezoid", "Parallelogram", "FiveDown", "Circle", "Diamond", "Star", "Capsule"}}]Use built-in settings for VertexShapeFunction in the "Rounded" collection:
ResourceData["VertexShapeFunction", "Rounded"]Table[DeBruijnGraph[2, 2, VertexShapeFunction -> vf, VertexSize -> 0.2, PlotLabel -> vf], {vf, ResourceData["VertexShapeFunction", "Rounded"]}]Use built-in settings for VertexShapeFunction in the "Concave" collection:
ResourceData["VertexShapeFunction", "Concave"]Table[DeBruijnGraph[2, 2, VertexShapeFunction -> vf, VertexSize -> 0.2, PlotLabel -> vf], {vf, ResourceData["VertexShapeFunction", "Concave"]}]DeBruijnGraph[2, 2, VertexShapeFunction -> { 1 -> "Square"}, VertexSize -> 0.2]Combine with a default vertex function:
DeBruijnGraph[2, 2, VertexShapeFunction -> { 1 -> "Square", "Triangle"}, VertexSize -> 0.2]Draw vertices using a predefined graphic:
DeBruijnGraph[2, 2, VertexShapeFunction -> (Inset[[image], #]&)]Draw vertices by running a program:
vf[{xc_, yc_}, name_, {w_, h_}] :=
	Block[{xmin = xc - w, xmax = xc + w, ymin = yc - h, ymax = yc + h},
	Polygon[{{xmin, ymin}, {xmax, ymax}, {xmin, ymax}, {xmax, ymin}}]
];DeBruijnGraph[2, 2, VertexShapeFunction -> vf, VertexSize -> 0.2]VertexShapeFunction can be combined with VertexStyle:
vf1[{xc_, yc_}, name_, {w_, h_}] := Rectangle[{xc - w, yc - h}, {xc + w, yc + h}]DeBruijnGraph[2, 2, VertexSize -> 0.2, VertexStyle -> Blue, VertexShapeFunction -> vf1]VertexShapeFunction has higher priority than VertexStyle:
vf2[{xc_, yc_}, name_, {w_, h_}] := {Red, Rectangle[{xc - w, yc - h}, {xc + w, yc + h}]}DeBruijnGraph[2, 2, VertexSize -> 0.2, VertexStyle -> Blue, VertexShapeFunction -> vf2]VertexShapeFunction can be combined with VertexSize:
DeBruijnGraph[2, 2, VertexShapeFunction -> "Star", VertexSize -> {1 -> Small, Medium}]VertexShapeFunction has higher priority than VertexShape:
DeBruijnGraph[2, 2, VertexSize -> 0.3, VertexShapeFunction -> "Star", VertexShape -> [image]]VertexSize (8)
By default, the size of vertices is computed automatically:
DeBruijnGraph[2, 2, VertexSize -> Automatic]Specify the size of all vertices using symbolic vertex size:
Table[DeBruijnGraph[2, 2, VertexSize -> s, PlotLabel -> s], {s, {Tiny, Small, Medium, Large}}]Use a fraction of the minimum distance between vertex coordinates:
Table[DeBruijnGraph[2, 2, VertexSize -> s, PlotLabel -> s], {s, 0.1, 1, 0.3}]Use a fraction of the overall diagonal for all vertex coordinates:
Table[DeBruijnGraph[2, 2, VertexSize -> {"Scaled", s}, PlotLabel -> {"Scaled", s}], {s, 0.1, 1, 0.3}]Specify size in both the ![]() and
and ![]() directions:
directions:
Table[DeBruijnGraph[2, 2, VertexSize -> s, PlotLabel -> s], {s, {{0.1, 0.2}, {0.2, 0.1}}}]Specify the size for individual vertices:
DeBruijnGraph[2, 2, VertexSize -> {1 -> 0.2, 2 -> 0.3}]VertexSize can be combined with VertexShapeFunction:
Table[DeBruijnGraph[2, 2, VertexSize -> s, VertexShapeFunction -> "Square", PlotLabel -> s], {s, {0.05, 0.1, 0.2}}]VertexSize can be combined with VertexShape:
Table[DeBruijnGraph[2, 2, VertexSize -> s, VertexShape -> [image], PlotLabel -> s], {s, {0.1, 0.2, 0.4}}]VertexStyle (5)
Table[DeBruijnGraph[2, 2, VertexStyle -> style, VertexSize -> 0.3, PlotLabel -> style], {style, {Yellow, EdgeForm[Dashed]}}]DeBruijnGraph[2, 2, VertexStyle -> {1 -> Blue, 2 -> Red}, VertexSize -> 0.2]VertexShapeFunction can be combined with VertexStyle:
vf1[{xc_, yc_}, name_, {w_, h_}] := Rectangle[{xc - w, yc - h}, {xc + w, yc + h}]DeBruijnGraph[2, 2, VertexSize -> 0.2, VertexStyle -> Blue, VertexShapeFunction -> vf1]VertexShapeFunction has higher priority than VertexStyle:
vf2[{xc_, yc_}, name_, {w_, h_}] := {Red, Rectangle[{xc - w, yc - h}, {xc + w, yc + h}]}DeBruijnGraph[2, 2, VertexSize -> 0.2, VertexStyle -> Blue, VertexShapeFunction -> vf2]VertexStyle can be combined with BaseStyle:
DeBruijnGraph[2, 2, VertexStyle -> LightBlue, BaseStyle -> EdgeForm[Dotted], VertexSize -> 0.2]VertexStyle has higher priority than BaseStyle:
DeBruijnGraph[2, 2, VertexStyle -> LightBlue, BaseStyle -> Gray, VertexSize -> 0.2]VertexShape is not affected by VertexStyle:
DeBruijnGraph[2, 2, VertexSize -> 0.2, VertexShape -> [image], VertexStyle -> Blue]VertexWeight (2)
Set the weight for all vertices:
DeBruijnGraph[2, 2, VertexWeight -> {2, 3, 4, 5}]AnnotationValue[{%, 1}, VertexWeight]Use any numeric expression as a weight:
DeBruijnGraph[2, 2, VertexWeight -> {a, b, c, d}]AnnotationValue[{%, 1}, VertexWeight]Applications (6)
The GraphCenter of De Bruijn graphs:
Table[HighlightGraph[#, GraphCenter[#]]&[DeBruijnGraph[2, i, VertexSize -> 0.2]], {i, 2, 4}]The GraphPeriphery:
Table[HighlightGraph[#, GraphPeriphery[#]]&[DeBruijnGraph[2, i, VertexSize -> 0.2]], {i, 2, 4}]The VertexEccentricity:
VertexEccentricity[DeBruijnGraph[2, 2], #]& /@ VertexList[DeBruijnGraph[2, 2]]Highlight the vertex eccentricity path:
FindVertexEccentricityPath[g_ ? DirectedGraphQ, u_] /; MemberQ[VertexList[g], u] := Module[{d = GraphDistanceMatrix[g], posu, posv, vl = VertexList[g]}, posu = VertexIndex[g, u];
	posv = First@First@Position[d[[posu]], Max[d[[posu]]]];
PathGraph[FindShortestPath[g, u, vl[[posv]]], DirectedEdges -> True]]Table[HighlightGraph[g = DeBruijnGraph[2, 2], FindVertexEccentricityPath[g, u]], {u, Range[4]}]The GraphRadius:
Table[GraphRadius[DeBruijnGraph[2, i]], {i, 2, 4}]FindRadiusPath[g_ ? DirectedGraphQ] := Module[{c = First@GraphCenter[g], d, v, pos}, d = Table[GraphDistance[g, c, u], {u, VertexList[g]}];
pos = First@Position[d, Max[d]];
v = First@Part[VertexList[g], pos];
PathGraph[FindShortestPath[g, c, v], DirectedEdges -> True]]Table[HighlightGraph[#, FindRadiusPath[#]]&[DeBruijnGraph[2, i, VertexSize -> Tiny]], {i, 2, 4}]The GraphDiameter:
Table[GraphDiameter[DeBruijnGraph[2, i]], {i, 2, 4}]FindDiameterPath[g_ ? DirectedGraphQ] := Module[{d = GraphDistanceMatrix[g], u, v, pos}, pos = First@Position[d, Max[d]];
{u, v} = Part[VertexList[g], pos];
PathGraph[FindShortestPath[g, u, v], DirectedEdges -> True]]Table[HighlightGraph[#, FindDiameterPath[#]]&[DeBruijnGraph[2, i, VertexSize -> Tiny]], {i, 2, 4}]Highlight the vertex degree for DeBruijnGraph:
HighlightCentrality[g_, cc_] := HighlightGraph[g, Table[Style[VertexList[g][[i]], ColorData["TemperatureMap"][cc[[i]] / Max[cc]]], {i, VertexCount[g]}]]g = DeBruijnGraph[3, 2, VertexSize -> Large];HighlightCentrality[g, VertexDegree[g]]Highlight the closeness centrality:
HighlightCentrality[g, ClosenessCentrality[g]]Highlight the eigenvector centrality:
HighlightCentrality[g, EigenvectorCentrality[g]]Properties & Relations (4)
DeBruijnGraph[m,n] has ![]() vertices:
vertices:
VertexCount[DeBruijnGraph[m, n]]DeBruijnGraph[m,n] has ![]() edges:
edges:
EdgeCount[DeBruijnGraph[m, n]]Each vertex has exactly ![]() incoming and
incoming and ![]() outgoing edges:
outgoing edges:
mat = AdjacencyMatrix[DeBruijnGraph[m = 2, 3]];The number of outgoing edges of each vertex:
(Plus@@mat)//NormalThe number of incoming edges of each vertex:
(Plus@@Transpose[mat])//NormalDeBruijnGraph[m,n] is the line graph of the DeBruijnGraph[m,n-1] with the same symbols:
{LineGraph[DeBruijnGraph[2, 1]], DeBruijnGraph[2, 2]}Possible Issues (1)
The setting DirectedEdges->False does not apply to DeBruijnGraph:
DeBruijnGraph[2, 2, DirectedEdges -> False]Text
Wolfram Research (2010), DeBruijnGraph, Wolfram Language function, https://reference.wolfram.com/language/ref/DeBruijnGraph.html.
CMS
Wolfram Language. 2010. "DeBruijnGraph." Wolfram Language & System Documentation Center. Wolfram Research. https://reference.wolfram.com/language/ref/DeBruijnGraph.html.
APA
Wolfram Language. (2010). DeBruijnGraph. Wolfram Language & System Documentation Center. Retrieved from https://reference.wolfram.com/language/ref/DeBruijnGraph.html