


DensityPlot3D
DensityPlot3D[f,{x,xmin,xmax},{y,ymin,ymax},{z,zmin,zmax}]
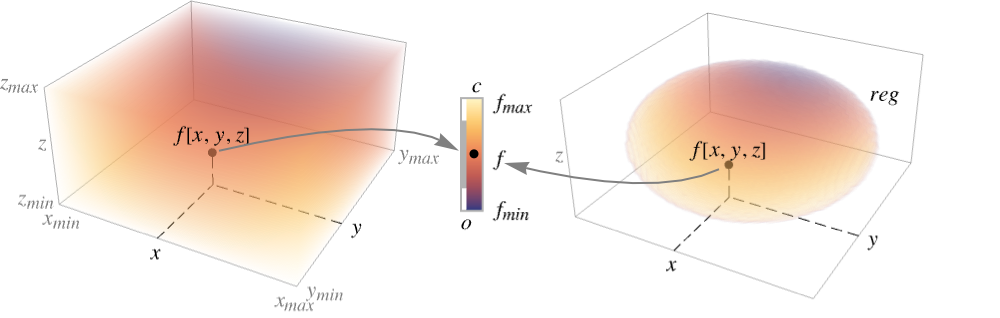
x,y,z の関数としての f の密度プロットを作成する.
DensityPlot3D[f,{x,y,z}∈reg]
変数が幾何学領域 reg にあるものとする.
詳細とオプション
- DensityPlot3Dはボリューム地図としても知られている.
- DensityPlot3Dは関数
 をその領域上で評価し,値を色と不透明度に個別にマップする.
 - 不透明度関数
 は,通常,ある範囲の値を可視化し他の値を不可視にするために使われる.
 - 以下のプロットは集合
 を可視化する.ただし,
 は色関数で
は色関数で  は不透明度の関数である.
 - f を評価しても実数にならない位置は,データが欠けているとみなされ,透過的に描かれる.
- DensityPlot3Dは,事実上Blockを使って変数 x,y,z を局所的なものとして扱う.
- DensityPlot3Dは属性HoldAllを有し,x,y,z に特定の数値を割り当てた後ではじめて f を評価する.
- 場合によってはEvaluateを使って,x,y,z に特定の数値が割り当てられる前に f を記号的に評価した方が効率的なことがある.
- DensityPlot3Dには,Graphics3Dと同じオプションに以下の追加・変更を加えたものが使える. [全オプションのリスト]
-
Axes True 軸を描くかどうか BoxRatios {1,1,1} 境界3Dボックスの比 ColorFunction Automatic プロットにどのように彩色するか ColorFunctionScaling True ColorFunctionの引数をスケールするかどうか OpacityFunction Automatic 各点での不透過性をどのように計算するか OpacityFunctionScaling True OpacityFunctionの引数をスケールするかどうか PerformanceGoal $PerformanceGoal パフォーマンスのどの面について最適化するか PlotLegends None 色勾配の凡例 PlotPoints Automatic 各方向の関数のサンプルの初期数 PlotRange {Full,Full,Full,Automatic} 含めるべき f のあるいは他の値の範囲 PlotTheme $PlotTheme プロットの全体的なテーマ RegionFunction (True&) 点を含めるかどうかをどのように決定するか ScalingFunctions None 個々の座標のスケール方法 TargetUnits Automatic 所望の使用単位 WorkingPrecision MachinePrecision 内部計算に使用する精度 - ColorFunctionおよびOpacityFunctionには,デフォルトで,f のスケールされた値で与えられる1引数が与えられる.
- OpacityFunctionのよく使われる設定
-
Automatic 自動的に決定 None 不透明度関数を使わず,完全に不透明 α 一定の不透明度Opacity[α] Interval[…] 区間の中の値をより不透明にする "Image3D" Image3Dで使われるデフォルトの不透明度関数 func 一般的な不透明度関数 - RegionFunctionに与えられる引数は,x,y,z,f である.
- 次は,ScalingFunctionsの可能な設定である.
-
sf f 等高線の値をスケールする {sx,sy,sz} x,y, z の各軸をスケールする {sx,sy,sz,sf} x,y, z の各軸と f 等高線の値をスケールする - 次は,よく使われる組込みのスケーリング関数 s である.
-
"Log" 
自動的に目盛ラベルを付ける対数スケール "Log10" 
10のベキ乗に目盛を置く,10を底とした対数スケール "SignedLog" 
0と負の数を含む対数に似たスケール "Reverse" 
座標の向きを逆にする "Infinite" 
無限スケール
全オプションのリスト
例題
すべて開く すべて閉じる例 (3)
DensityPlot3D[x y z, {x, -1, 1}, {y, -1, 1}, {z, -1, 1}]DensityPlot3D[Sin[x]Cos[y]Sin[z], {x, y, z}∈Ball[{0, 0, 0}, 5], PlotTheme -> "Marketing"]f = PDF[DirichletDistribution[{1, 2, 3, 4}], {x, y, z}]DensityPlot3D[f, {x, 0, 0.5}, {y, 0, 1}, {z, 0, 1}, ColorFunction -> "SunsetColors", PlotLegends -> Automatic]スコープ (13)
サンプリング (6)
DensityPlot3D[Sqrt[x y z], {x, y, z}∈Ball[], OpacityFunction -> None]PlotPointsを使ってサンプリングを制御する:
Table[DensityPlot3D[x y z, {x, -1, 1}, {y, -1, 1}, {z, -1, 1}, PlotPoints -> pp], {pp, {5, 20, 50}}]領域はConeを含む領域で指定することができる:
DensityPlot3D[x y z, {x, y, z}∈Cone[]]ImplicitRegionを含む数式定義領域:
ℛ = ImplicitRegion[(x ^ 2 + (9 / 4)y ^ 2 + z ^ 2 - 1) ^ 3 - x ^ 2z ^ 3 - (9 / 80)y ^ 2z ^ 3 <= 0, {{x, -1.2, 1.2}, {y, -0.7, 0.7}, {z, -1, 1.3}}];DensityPlot3D[x y z, {x, y, z}∈ℛ]BoundaryMeshRegionを含む,メッシュに基づいた領域:
ℛ = ConvexHullMesh[RandomReal[1, {25, 3}]]DensityPlot3D[x y z, {x, y, z}∈ℛ]PlotRangeを使ってより詳細が露出されるように範囲を限定する:
DensityPlot3D[Exp[-(x ^ 2 + y ^ 2 + z ^ 2)], {x, -1, 1}, {y, -1, 1}, {z, -1, 1}, PlotRange -> {{-1, 0}, All, All}, BoxRatios -> Automatic]ClipPlanesを使って1つあるいは複数の切り取り平面を指定する.この場合は ![]() を切り取る:
を切り取る:
DensityPlot3D[Sin[x + y + z] / 10, {x, 0, 10}, {y, 0, 10}, {z, 0, 10}, OpacityFunction -> None, ClipPlanes -> {1, 1, -1, 0}]RegionFunctionを使って点の含み方をより一般的に制約する:
DensityPlot3D[x ^ 2 + y ^ 2 - z ^ 2, {x, -2, 2}, {y, -2, 2}, {z, -2, 2}, RegionFunction -> Function[{x, y, z, f}, x < y ^ 3]]プレゼンテーション (7)
PlotThemeを使って即座に全体的なスタイリングを得る:
Table[DensityPlot3D[x y z, {x, -1, 1}, {y, -1, 1}, {z, -1, 1}, PlotLabel -> t, PlotTheme -> t], {t, {"Minimal", "Scientific", "Marketing"}}]PlotLegendsを使って異なる値のための色の棒を得る:
DensityPlot3D[x y z, {x, -1, 1}, {y, -1, 1}, {z, -1, 1}, PlotLegends -> Automatic]Axesで軸の表示を制御する:
Table[DensityPlot3D[x y z, {x, -1, 1}, {y, -1, 1}, {z, -1, 1}, PlotLabel -> a, Axes -> a], {a, {True, False, {True, False, True}}}]AxesLabelを使って軸に,PlotLabelを使ってプロット全体にラベルを付ける:
DensityPlot3D[x y z, {x, -1, 1}, {y, -1, 1}, {z, -1, 1}, Ticks -> None, AxesLabel -> {x, y, z}, PlotLabel -> x y z]ColorFunctionを使い,関数の値でプロットに彩色する:
Table[DensityPlot3D[x y z, {x, -1, 1}, {y, -1, 1}, {z, -1, 1}, PlotLabel -> c, ColorFunction -> c], {c, {Hue, "BlueGreenYellow"}}]TargetUnitsは可視化に使う単位を指定する:
DensityPlot3D[Quantity[x y z, "kg/m^3"], {x, -1, 1}, {y, -1, 1}, {z, -1, 1}, AxesLabel -> Automatic, PlotLegends -> Automatic, TargetUnits -> {"Feet", "Feet", "Feet", "g/ft^3"}]DensityPlot3D[Sin[2π x]Sin[2π y] + z, {x, 0, 1}, {y, 0, 1}, {z, 0, 1}, ScalingFunctions -> {"Log", None, None}]DensityPlot3D[Sin[2π x]Sin[2π y] + z, {x, 0, 1}, {y, 0, 1}, {z, 0, 1}, ScalingFunctions -> {None, None, "Reverse"}]オプション (69)
Axes (4)
デフォルトで,DensityPlot3Dは軸ではなく枠を使う:
DensityPlot3D[Sin[2π x]Sin[2π y]Sin[2π z], {x, -1, 1}, {y, -1, 1}, {z, -1, 1}]DensityPlot3D[Sin[2π x]Sin[2π y]Sin[2π z], {x, -1, 1}, {y, -1, 1}, {z, -1, 1}, Axes -> False]AxesOriginを使って軸の交点を指定する:
DensityPlot3D[Sin[2π x]Sin[2π y]Sin[2π z], {x, -1, 1}, {y, -1, 1}, {z, -1, 1}, AxesOrigin -> {0, 0, 0}]{DensityPlot3D[Sin[2π x]Sin[2π y]Sin[2π z], {x, -1, 1}, {y, -1, 1}, {z, -1, 1}, Axes -> {False, False, True}], DensityPlot3D[Sin[2π x]Sin[2π y]Sin[2π z], {x, -1, 1}, {y, -1, 1}, {z, -1, 1}, Axes -> {True, False, False}], DensityPlot3D[Sin[2π x]Sin[2π y]Sin[2π z], {x, -1, 1}, {y, -1, 1}, {z, -1, 1}, Axes -> {False, True, False}]}AxesLabel (4)
DensityPlot3D[Sin[2π x]Sin[2π y]Sin[2π z], {x, -1, 1}, {y, -1, 1}, {z, -1, 1}]DensityPlot3D[Sin[2π x]Sin[2π y]Sin[2π z], {x, -1, 1}, {y, -1, 1}, {z, -1, 1}, AxesLabel -> z]DensityPlot3D[Sin[2π x]Sin[2π y]Sin[2π z], {x, -1, 1}, {y, -1, 1}, {z, -1, 1}, AxesLabel -> {"X", "Y", "Z"}]DensityPlot3Dで指定された変数に基づくラベルを使う:
DensityPlot3D[Sin[2π x]Sin[2π y]Sin[2π z], {x, -1, 1}, {y, -1, 1}, {z, -1, 1}, AxesLabel -> Automatic]AxesOrigin (2)
AxesStyle (4)
DensityPlot3D[Sin[2π x]Sin[2π y]Sin[2π z], {x, -1, 1}, {y, -1, 1}, {z, -1, 1}, AxesStyle -> Red]DensityPlot3D[Sin[2π x]Sin[2π y]Sin[2π z], {x, -1, 1}, {y, -1, 1}, {z, -1, 1}, AxesStyle -> {{Thick, Brown}, {Thick, Blue}, {Thick, Green}}]DensityPlot3D[Sin[2π x]Sin[2π y]Sin[2π z], {x, -1, 1}, {y, -1, 1}, {z, -1, 1}, AxesStyle -> Green, TicksStyle -> StandardBlue]DensityPlot3D[Sin[2π x]Sin[2π y]Sin[2π z], {x, -1, 1}, {y, -1, 1}, {z, -1, 1}, AxesStyle -> Green, LabelStyle -> StandardBlue]BoxRatios (2)
DensityPlot3D[Sin[x ]Cos[y] Sin[z], {x, -Pi / 2, 3Pi / 2}, {y, -Pi / 2, 3Pi / 2}, {z, -3Pi, 3Pi}]BoxRatios->Automaticを使って3D座標値の自然なスケールを示す:
DensityPlot3D[Sin[x ]Cos[y] Sin[z], {x, -Pi / 2, 3Pi / 2}, {y, -Pi / 2, 3Pi / 2}, {z, -3Pi, 3Pi}, BoxRatios -> Automatic]ClipPlanes (3)
ClipPlanesを使って1つあるいは複数の切取り平面を指定する.この場合は ![]() を切り取る:
を切り取る:
DensityPlot3D[Sin[x + y + z] / 10, {x, 0, 10}, {y, 0, 10}, {z, 0, 10}, OpacityFunction -> None, ClipPlanes -> {{1, 1, -1, 0}}]DensityPlot3D[Sin[x + y + z] / 10, {x, 0, 10}, {y, 0, 10}, {z, 0, 10}, OpacityFunction -> None, ClipPlanes -> {{1, 1, -1, 0}, {0, 1, 0, -4}}]一般的なRegionFunctionと比較する:
DensityPlot3D[Sin[x + y + z] / 10, {x, 0, 10}, {y, 0, 10}, {z, 0, 10}, OpacityFunction -> None, RegionFunction -> Function[{x, y, z}, x + y - z ≥ 0]]ColorFunction (1)
ColorFunctionScaling (2)
ColorFunctionのパラメータは0から1の間に正規的にスケールされる:
DensityPlot3D[x + y + z, {x, 0, 3}, {y, 0, 3}, {z, 0, 3}, ColorFunction -> Hue]ColorFunctionScalingをFalseに設定してスケールされていない密度の値を使う:
DensityPlot3D[Sin[2x y z], {x, -2, 2}, {y, -2, 2}, {z, -2, 2}, ColorFunction -> (If[# < 0, Red, Green]&), ColorFunctionScaling -> False, PlotPoints -> 100]ImageSize (7)
Tiny,Small,Medium,Largeのように名前付きのサイズを使う:
{DensityPlot3D[Sin[2π x]Sin[2π y]Sin[2π z], {x, -1, 1}, {y, -1, 1}, {z, -1, 1}, ImageSize -> Tiny], DensityPlot3D[Sin[2π x]Sin[2π y]Sin[2π z], {x, -1, 1}, {y, -1, 1}, {z, -1, 1}, ImageSize -> Small]}{DensityPlot3D[Sin[2π x]Sin[2π y]Sin[2π z], {x, -1, 1}, {y, -1, 1}, {z, -1, 1}, ImageSize -> 150], DensityPlot3D[Sin[2π x]Sin[2π y]Sin[2π z], {x, -1, 1}, {y, -1, 1}, {z, -1, 1}, AspectRatio -> 1.5, ImageSize -> 150]}{DensityPlot3D[Sin[2π x]Sin[2π y]Sin[2π z], {x, -1, 1}, {y, -1, 1}, {z, -1, 1}, ImageSize -> {Automatic, 150}], DensityPlot3D[Sin[2π x]Sin[2π y]Sin[2π z], {x, -1, 1}, {y, -1, 1}, {z, -1, 1}, AspectRatio -> 2, ImageSize -> {Automatic, 150}]}{DensityPlot3D[Sin[2π x]Sin[2π y]Sin[2π z], {x, -1, 1}, {y, -1, 1}, {z, -1, 1}, ImageSize -> UpTo[200]], DensityPlot3D[Sin[2π x]Sin[2π y]Sin[2π z], {x, -1, 1}, {y, -1, 1}, {z, -1, 1}, AspectRatio -> 2, ImageSize -> UpTo[200]]}グラフィックスの幅と高さを指定し,必要な場合はスペースで充填する:
DensityPlot3D[Sin[2π x]Sin[2π y]Sin[2π z], {x, -1, 1}, {y, -1, 1}, {z, -1, 1}, ImageSize -> {200, 300}, Background -> StandardGray]AspectRatioFullとすると使用可能なスペースが埋められる:
DensityPlot3D[Sin[2π x]Sin[2π y]Sin[2π z], {x, -1, 1}, {y, -1, 1}, {z, -1, 1}, AspectRatio -> Full, ImageSize -> {200, 300}, Background -> StandardGray]{DensityPlot3D[Sin[2π x]Sin[2π y]Sin[2π z], {x, -1, 1}, {y, -1, 1}, {z, -1, 1}, ImageSize -> {UpTo[150], UpTo[100]}], DensityPlot3D[Sin[2π x]Sin[2π y]Sin[2π z], {x, -1, 1}, {y, -1, 1}, {z, -1, 1}, AspectRatio -> 2, ImageSize -> {UpTo[150], UpTo[100]}]}ImageSizeFullを使ってオブジェクトの中の使用可能なスペースを埋める:
Framed[Pane[DensityPlot3D[Sin[2π x]Sin[2π y]Sin[2π z], {x, -1, 1}, {y, -1, 1}, {z, -1, 1}, ImageSize -> Full, Background -> StandardGray], {200, 100}]]Framed[Pane[DensityPlot3D[Sin[2π x]Sin[2π y]Sin[2π z], {x, -1, 1}, {y, -1, 1}, {z, -1, 1}, AspectRatio -> Full, ImageSize -> {Scaled[0.5], Scaled[0.5]}, Background -> StandardGray], {200, 200}]]OpacityFunction (6)
OpacityFunctionは,デフォルトでAutomaticである:
DensityPlot3D[x y z, {x, -1, 1}, {y, -1, 1}, {z, -1, 1}]OpacityFunctionNoneで透過性をオフにする:
DensityPlot3D[x y z, {x, -1, 1}, {y, -1, 1}, {z, -1, 1}, OpacityFunction -> None]DensityPlot3D[Sin[π x]Sin[π y] Sin[π z], {x, -1, 1}, {y, -1, 1}, {z, -1, 1}, OpacityFunction -> Interval[{-1, -0.6}, {0.6, 1}], OpacityFunctionScaling -> False, PlotLegends -> Automatic]一定の不透明度Opacity[0.05]を使う:
DensityPlot3D[Sin[π x]Sin[π y] Sin[π z], {x, -1, 1}, {y, -1, 1}, {z, -1, 1}, OpacityFunction -> 0.05, PlotLegends -> Automatic]Image3Dで使われているものと同じ不透明度関数を使う:
f = PDF[DirichletDistribution[{1, 2, 3, 4}], {x, y, z}];DensityPlot3D[f, {x, 0, 1}, {y, 0, 1}, {z, 0, 1}, OpacityFunction -> "Image3D", PlotLegends -> Automatic]カスタムの不透明度関数を使って各密度値の不透明度を指定する:
DensityPlot3D[x y z, {x, -1, 1}, {y, -1, 1}, {z, -1, 1}, OpacityFunction -> Function[f, (1 - f) ^ 2]]OpacityFunctionScaling (3)
DensityPlot3D[x y z, {x, -1, 1}, {y, -1, 1}, {z, -1, 1}, OpacityFunction -> Function[f, (1 - f) ^ 2]]OpacityFunctionScalingをFalseにしてスケールされていない密度値を使う:
DensityPlot3D[x + y + z, {x, -1, 1}, {y, -1, 1}, {z, -1, 1}, OpacityFunction -> Function[f, If[f > 0, 1, 0]], OpacityFunctionScaling -> False]DensityPlot3D[x y z, {x, -1, 1}, {y, -1, 1}, {z, -1, 1}, OpacityFunction -> Interval[{-1, 0}], OpacityFunctionScaling -> False, PlotLegends -> Automatic, ColorFunction -> "BrightBands"]PerformanceGoal (2)
PlotLegends (2)
DensityPlot3D[x y z, {x, -1, 1}, {y, -1, 1}, {z, -1, 1}]PlotLegends->Automaticを使ってプロットに凡例を付ける:
DensityPlot3D[x y z, {x, -1, 1}, {y, -1, 1}, {z, -1, 1}, PlotLegends -> Automatic]PlotPoints (2)
PlotPoints (3)
DensityPlot3D[Exp[-(x ^ 2 + y ^ 2 + z ^ 2)], {x, -1, 1}, {y, -1, 1}, {z, -1, 1}]DensityPlot3D[Exp[-(x ^ 2 + y ^ 2 + z ^ 2)], {x, -1, 1}, {y, -1, 1}, {z, -1, 1}, PlotRange -> {{-1, 0}, All, All}, BoxRatios -> Automatic]DensityPlot3D[x ^ 2 + y ^ 2 - z ^ 2, {x, -2, 2}, {y, -2, 2}, {z, -2, 2}, PlotRange -> {0, 1}]DensityPlot3D[x ^ 2 + y ^ 2 - z ^ 2, {x, -2, 2}, {y, -2, 2}, {z, -2, 2}, PlotRange -> {All, All, All, {0, 1}}]PlotTheme (3)
DensityPlot3D[x y z, {x, -1, 1}, {y, -1, 1}, {z, -1, 1}, PlotTheme -> "Marketing"]オプション設定はテーマによる設定を無効にする.この場合は面格子が除かれる:
DensityPlot3D[x y z, {x, -1, 1}, {y, -1, 1}, {z, -1, 1}, PlotTheme -> "Marketing", FaceGrids -> None]Table[DensityPlot3D[x y z, {x, -1, 1}, {y, -1, 1}, {z, -1, 1}, PlotLabel -> t, PlotTheme -> t, ImageSize -> 130], {t, {"Scientific", "Monochrome", "Minimal", "Web", "Working", "Classic", "Business", "Marketing", "Detailed"}}]RegionFunction (3)
DensityPlot3D[x ^ 2 + y ^ 2 - z ^ 2, {x, -2, 2}, {y, -2, 2}, {z, -2, 2}, RegionFunction -> Function[{x, y, z, f}, x ^ 2 + y ^ 2 + z ^ 2 ≤ 4]]DensityPlot3D[x ^ 2 + y ^ 2 - z ^ 2, {x, -2, 2}, {y, -2, 2}, {z, -2, 2}, RegionFunction -> Function[{x, y, z, f}, f < 2]]DensityPlot3D[x ^ 2 + y ^ 2 - z ^ 2, {x, -2, 2}, {y, -2, 2}, {z, -2, 2}, RegionFunction -> Function[{x, y, z, f}, x < -1 || x > 1]]ScalingFunctions (4)
デフォルトで,DensityPlot3Dはすべての方向に線形スケールを使う:
DensityPlot3D[x + y + z, {x, 0, 10}, {y, 0, 10}, {z, 0, 10}]DensityPlot3D[x + y + z, {x, 0, 10}, {y, 0, 10}, {z, 0, 10}, ScalingFunctions -> {"Log", None, None}]ScalingFunctionsを使って ![]() 方向の座標の向きを逆にする:
方向の座標の向きを逆にする:
DensityPlot3D[x + y + z, {x, 0, 10}, {y, 0, 10}, {z, 0, 10}, ScalingFunctions -> {None, None, "Reverse"}]関数とその逆関数を指定して,関数によって胃定義されたスケールを使う:
DensityPlot3D[x + y + z, {x, 0, 10}, {y, 0, 10}, {z, 0, 10}, ScalingFunctions -> {{-Log[#]&, Exp[-#]&}, None, None}]TargetUnits (2)
軸と凡例にはTargetUnitsで指定された単位のラベルが付けられる:
DensityPlot3D[x y z, {x, -1, 1}, {y, -1, 1}, {z, -1, 1}, AxesLabel -> Automatic, PlotLegends -> Automatic, TargetUnits -> {"Meters", "Meters", "Meters", "kg/m^3"}]Quantityで指定された単位はTargetUnitsで指定された単位に変換される:
DensityPlot3D[Quantity[x y z, "kg/m^3"], {x, -1, 1}, {y, -1, 1}, {z, -1, 1}, PlotLegends -> Automatic, TargetUnits -> "g/ft^3"]Ticks (6)
DensityPlot3D[ Cos[ y] Sin[z], {x, -2, 2}, {y, -2, 2}, {z, -2, 2}]DensityPlot3D[ Cos[ y] Sin[z], {x, -2, 2}, {y, -2, 2}, {z, -2, 2}, Ticks -> None]DensityPlot3D[ Cos[ y] Sin[z], {x, -2, 2}, {y, -2, 2}, {z, -2, 2}, Ticks -> {{-1.5, 0, 1.5}, {-1.5, 0, 1.5}, {-1.5, 0, 1.5}}]DensityPlot3D[ Cos[ y] Sin[z], {x, -2, 2}, {y, -2, 2}, {z, -2, 2}, Ticks -> {{{-1.5, -a}, {0, 0}, {1.5, a}}, {{-1.5, -a}, {0, 0}, {1.5, a}}, {{-1.5, -a}, {0, 0}, {1.5, a}}}]DensityPlot3D[ Cos[ y] Sin[z], {x, -2, 2}, {y, -2, 2}, {z, -2, 2}, Ticks -> {{{-1.5, -a, .1}, {0, 0, .1}, {1.5, a, .1}}, {{-1.5, -a, .05}, {0, 0, .05}, {1.5, a, .05}}, {{-1.5, -a, .15}, {0, 0, .15}, {1.5, a, .15}}}]DensityPlot3D[ Cos[ y] Sin[z], {x, -2, 2}, {y, -2, 2}, {z, -2, 2}, Ticks -> {{{-1.5, -a, .1, Directive[Red, Dashed, Thick]}, {0, 0, .1, Directive[Red, Dashed]}, {1.5, a, .1, Directive[Red]}}, {{-1.5, -a, .05, Directive[Blue, Dashed, Thick]}, {0, 0, .05, Directive[Blue, Dashed]}, {1.5, a, .05, Directive[Blue]}}, {{-1.5, -a, .15, Directive[Darker@Green, Dashed, Thick]}, {0, 0, .15, Directive[Darker@Green, Dashed]}, {1.5, a, .15, Directive[Darker@Green]}}}]TicksStyle (3)
デフォルトで,目盛と目盛ラベルには軸と同じスタイルが使われる:
DensityPlot3D[ Cos[ y] Sin[z], {x, -2, 2}, {y, -2, 2}, {z, -2, 2}, AxesStyle -> Directive[Thick, Red]]DensityPlot3D[ Cos[ y] Sin[z], {x, -2, 2}, {y, -2, 2}, {z, -2, 2}, TicksStyle -> Directive[Bold, Red]]DensityPlot3D[ Cos[ y] Sin[z], {x, -2, 2}, {y, -2, 2}, {z, -2, 2}, TicksStyle -> {Directive[Green, Bold], Directive[Bold, Red], Directive[Bold, Blue]}]アプリケーション (17)
初等関数 (4)
DensityPlot3D[x, {x, -2, 2}, {y, -2, 2}, {z, -2, 2}]{DensityPlot3D[y, {x, -2, 2}, {y, -2, 2}, {z, -2, 2}],
DensityPlot3D[z, {x, -2, 2}, {y, -2, 2}, {z, -2, 2}]}{DensityPlot3D[x + y, {x, -2, 2}, {y, -2, 2}, {z, -2, 2}],
DensityPlot3D[y + z, {x, -2, 2}, {y, -2, 2}, {z, -2, 2}]}{DensityPlot3D[x + y + z, {x, -2, 2}, {y, -2, 2}, {z, -2, 2}],
DensityPlot3D[x - y + z, {x, -2, 2}, {y, -2, 2}, {z, -2, 2}]}{DensityPlot3D[x ^ 2 + y ^ 2, {x, -2, 2}, {y, -2, 2}, {z, -2, 2}], DensityPlot3D[y ^ 2 + z ^ 2, {x, -2, 2}, {y, -2, 2}, {z, -2, 2}]}{DensityPlot3D[x ^ 2 + y ^ 2 + z ^ 2, {x, -2, 2}, {y, -2, 2}, {z, -2, 2}], DensityPlot3D[x ^ 2 + y ^ 2 + 2z ^ 2, {x, -2, 2}, {y, -2, 2}, {z, -2, 2}]}DensityPlot3D[Sin[π x]Sin[π y]Sin[π z], {x, -2, 2}, {y, -2, 2}, {z, -2, 2}]{DensityPlot3D[Sin[π x]Sin[π (y + z)], {x, -2, 2}, {y, -2, 2}, {z, -2, 2}], DensityPlot3D[Sin[π (x + y)]Sin[π z], {x, -2, 2}, {y, -2, 2}, {z, -2, 2}]}DensityPlot3D[Sin[π (x + y + z)], {x, -2, 2}, {y, -2, 2}, {z, -2, 2}]f = Exp[-Norm[{x, y, z} - {-1, -1, -1}]^2] + Exp[-Norm[{x, y, z} - {1, 1, 1}]^2];DensityPlot3D[f, {x, -2, 2}, {y, -2, 2}, {z, -2, 2}]f = Sum[Exp[-2Norm[{x, y, z} - pi]^2], {pi, RandomPoint[Cuboid[{-1, -1, -1}, {1, 1, 1}], 10]}];DensityPlot3D[f, {x, -2, 2}, {y, -2, 2}, {z, -2, 2}]分布関数 (6)
分布のPDFをプロットする:
𝒟 = MultinormalDistribution[{0, 0, 0}, {{1, 0.5, 0}, {0.5, 1, 0}, {0, 0, 1}}];
f = PDF[𝒟, {x, y, z}];d = DensityPlot3D[f, {x, -2, 2}, {y, -2, 2}, {z, -2, 2}]pts = RandomVariate[𝒟, 10 ^ 4];Show[d, Graphics3D[{Green, AbsolutePointSize[1], Point[pts]}]]分布のCDFをプロットする:
𝒟 = MultinormalDistribution[{0, 0, 0}, {{1, 0.5, 0}, {0.5, 1, 0}, {0, 0, 1}}];
cdf = CDF[𝒟, {x, y, z}];DensityPlot3D[cdf, {x, -2, 2}, {y, -2, 2}, {z, -2, 2}, PlotLegends -> Automatic]sf = SurvivalFunction[𝒟, {x, y, z}];DensityPlot3D[sf, {x, -2, 2}, {y, -2, 2}, {z, -2, 2}, PlotLegends -> Automatic]hf = HazardFunction[𝒟, {x, y, z}];DensityPlot3D[hf, {x, -2, 2}, {y, -2, 2}, {z, -2, 2}, PlotLegends -> Automatic]MultinormalDistributionについてのCorrelationパラメータを調べる.ただし,ρabはa と b との相関である:
cov[{σx_, σy_, σz_}, {ρxy_, ρyz_, ρxz_}] := {{σx^2, σx σy ρxy, σx σz ρxz}, {σx σy ρxy, σy^2, σy σz ρyz}, {σx σz ρxz, σy σz ρyz, σz^2}};Σ = cov[{1, 1, 1}, {0.5, 0, 0}];
f = PDF[MultinormalDistribution[{0, 0, 0}, Σ], {x, y, z}];DensityPlot3D[f, {x, -2, 2}, {y, -2, 2}, {z, -2, 2}]Σ = cov[{1, 1, 1}, {0, 0.5, 0}];
f = PDF[MultinormalDistribution[{0, 0, 0}, Σ], {x, y, z}];DensityPlot3D[f, {x, -2, 2}, {y, -2, 2}, {z, -2, 2}]y と z の間のみの,z 成分中のより大きい分散 ![]() のある相関:
のある相関:
Σ = cov[{1, 1, 2}, {0, 0.5, 0}];
f = PDF[MultinormalDistribution[{0, 0, 0}, Σ], {x, y, z}];DensityPlot3D[f, {x, -2, 2}, {y, -2, 2}, {z, -4, 4}, BoxRatios -> Automatic]ProductDistributionのPDFを可視化する:
𝒟 = ProductDistribution[{NormalDistribution[0, 1], 3}];
f = PDF[𝒟, {x, y, z}]DensityPlot3D[f, {x, -2, 2}, {y, -2, 2}, {z, -2, 2}]𝒟 = ProductDistribution[NormalDistribution[], LaplaceDistribution[], WeibullDistribution[1, 1]];
f = PDF[𝒟, {x, y, z}]DensityPlot3D[f, {x, -2, 2}, {y, -2, 2}, {z, 0, 5}]𝒟 = ProductDistribution[BinormalDistribution[1 / 2], ExponentialDistribution[3]];
f = PDF[𝒟, {x, y, z}]DensityPlot3D[f, {x, -2, 2}, {y, -2, 2}, {z, 0, 3}]CopulaDistributionのPDFをプロットする:
𝒟 = CopulaDistribution[{"Frank", 1}, {GammaDistribution[3, 2 / 3], ExponentialDistribution[2], NormalDistribution[]}];
f = PDF[𝒟, {x, y, z}]DensityPlot3D[f, {x, 0, 6}, {y, 0, 3}, {z, -3, 3}]ある三変量データのカーネル密度推定のPDFを可視化する:
data = RandomVariate[NormalDistribution[], {1000, 3}];
f = PDF[SmoothKernelDistribution[data], {x, y, z}];DensityPlot3D[f, {x, -3, 3}, {y, -3, 3}, {z, -3, 3}]ClipPlanesを使って中心を通してみる:
DensityPlot3D[f, {x, -3, 3}, {y, -3, 3}, {z, -3, 3}, ClipPlanes -> {1, 1, -1, 0}]偏微分方程式 (3)
非線形sine-Gordon方程式を周期的境界条件を持ち ![]() 軸に沿って時間を表現された2つの空間次元で可視化する:
軸に沿って時間を表現された2つの空間次元で可視化する:
L = 4;
usol = NDSolveValue[{D[u[t, x, y], t, t] == D[u[t, x, y], x, x] + D[u[t, x, y], y, y] + Sin[u[t, x, y]], u[t, -L, y] == u[t, L, y], u[t, x, -L] == u[t, x, L], u[0, x, y] == Exp[-(x ^ 2 + y ^ 2)], Derivative[1, 0, 0][u][0, x, y] == 0}, u, {t, 0, L / 2}, {x, -L, L}, {y, -L, L}]DensityPlot3D[usol[t, x, y], {x, -L, L}, {y, -L, L}, {t, 0, L / 2}, AxesLabel -> Automatic, PlotLegends -> Automatic]DensityPlot3D[usol[t, x, y], {x, -L, L}, {y, -L, L}, {t, 0, L / 2}, AxesLabel -> Automatic, ClipPlanes -> {0, 1, 0, 0}]Wolframの非線形波動方程式を,時間が ![]() 軸に沿って表された2つの空間次元で可視化する:
軸に沿って表された2つの空間次元で可視化する:
usol = NDSolveValue[{D[u[t, x, y], t, t] == D[u[t, x, y], x, x] + D[u[t, x, y], y, y] / 2 + (1 - u[t, x, y] ^ 2)(1 + 2u[t, x, y]), u[0, x, y] == E^-(x^2 + y^2), u[t, -5, y] == u[t, 5, y], u[t, x, -5] == u[t, x, 5], u^(1, 0, 0)[0, x, y] == 0}, u, {t, 0, 4}, {x, -5, 5}, {y, -5, 5}]DensityPlot3D[usol[t, x, y], {x, -5, 5}, {y, -5, 5}, {t, 1, 4}, AxesLabel -> Automatic, ClipPlanes -> {0, 1, 0, 0}, ColorFunction -> "BrightBands", PlotLegends -> Automatic]3D偏微分方程式の解を可視化する.この場合は,Ballとディリクレ(Dirichlet)境界条件上でのポアソン(Poisson)方程式:
usol = NDSolveValue[{Subsuperscript[∇, {x, y, z}, 2]u[x, y, z] == 1, DirichletCondition[u[x, y, z] == x y z, True]}, u, {x, y, z}∈Ball[]]DensityPlot3D[usol[x, y, z], {x, y, z}∈Ball[], PlotLegends -> Automatic]ポテンシャル関数と波動関数 (4)
v = Total[Table[1 / Norm[{x, y, z} - p], {p, RandomReal[{-0.5, 0.5}, {5, 3}]}]];DensityPlot3D[v, {x, -1, 1}, {y, -1, 1}, {z, -1, 1}]f = Sum[Cos[10 Norm[{x, y, z} - {Sin[θ], 0, Cos[θ]}]], {θ, 0, (4 π/3), (2 π/3)}]DensityPlot3D[f, {x, -1, 1}, {y, -1, 1}, {z, -1, 1}, PlotTheme -> "Minimal"]f = (((x y) Exp[I ((6π/5) - π Sqrt[x^2 + y^2 + z^2])]) (-1 + 2 I + (3 + I/Sqrt[x^2 + y^2 + z^2]))/(x^2 + y^2 + z^2) Sqrt[x^2 + y^2 + z^2]);DensityPlot3D[Clip[Re[f], {-50, 50}], {x, -0.5, 0.5}, {y, -0.5, 0.5}, {z, -0.5, 0.5}, PlotLegends -> Automatic, OpacityFunctionScaling -> False, OpacityFunction -> Interval[{-50, -10}, {10, 50}], ColorFunction -> "RedGreenSplit"]a0 = Quantity["BohrRadius"] / Quantity["Meters"]ψ[{n_, l_, m_}, {r_, θ_, ϕ_}] := With[{ρ = 2r / (n a0)}, Sqrt[((2/n a0))^3((n - l - 1)!/2n(n + l)!)]Exp[-ρ / 2]ρ^lLaguerreL[n - l - 1, 2l + 1, ρ]SphericalHarmonicY[l, m, θ, ϕ]]DensityPlot3D[(Abs@ψ[{2, 1, 0}, {Sqrt[x^2 + y^2 + z^2], ArcTan[z, Sqrt[x^2 + y^2]], ArcTan[x, y]}])^2, {x, -5 a0, 5 a0}, {y, -5 a0, 5 a0}, {z, -5 a0, 5 a0}, PlotLegends -> Automatic]特性と関係 (5)
データにListDensityPlot3Dを使う:
data = Table[x y z, {x, -1, 1, 0.05}, {y, -1, 1, 0.05}, {z, -1, 1, 0.05}];{ListDensityPlot3D[data], DensityPlot3D[x y z, {x, -2, 2}, {y, -2, 2}, {z, -2, 2}]}2D密度プロットにDensityPlotを使う:
{DensityPlot[x ^ 2 + y ^ 2, {x, -1, 1}, {y, -1, 1}], DensityPlot3D[x ^ 2 + y ^ 2, {x, -1, 1}, {y, -1, 1}, {z, -1, 1}, OpacityFunction -> None]}SliceDensityPlot3Dをスライス面上の密度プロットに使う:
{SliceDensityPlot3D[x y z, "BackPlanes", {x, -2, 2}, {y, -2, 2}, {z, -2, 2}], DensityPlot3D[x y z, {x, -2, 2}, {y, -2, 2}, {z, -2, 2}]}SliceContourPlot3Dをスライス面上の等高線プロットに使う:
{SliceContourPlot3D[x y z, "BackPlanes", {x, -2, 2}, {y, -2, 2}, {z, -2, 2}], DensityPlot3D[x y z, {x, -2, 2}, {y, -2, 2}, {z, -2, 2}]}ContourPlot3Dを値が一定の面について使う:
{ContourPlot3D[x ^ 2 + y ^ 2 + z ^ 2, {x, -2, 2}, {y, -2, 2}, {z, -2, 2}], DensityPlot3D[x ^ 2 + y ^ 2 + z ^ 2, {x, -2, 2}, {y, -2, 2}, {z, -2, 2}]}テキスト
Wolfram Research (2015), DensityPlot3D, Wolfram言語関数, https://reference.wolfram.com/language/ref/DensityPlot3D.html (2022年に更新).
CMS
Wolfram Language. 2015. "DensityPlot3D." Wolfram Language & System Documentation Center. Wolfram Research. Last Modified 2022. https://reference.wolfram.com/language/ref/DensityPlot3D.html.
APA
Wolfram Language. (2015). DensityPlot3D. Wolfram Language & System Documentation Center. Retrieved from https://reference.wolfram.com/language/ref/DensityPlot3D.html