



FeatureValueImpactPlot
FeatureValueImpactPlot[model,data]
data 中の与えられた特徴の値の model の結果に対するインパクトをプロットする.
FeatureValueImpactPlot[model]
合成データを使って特徴値のインパクトを推定する.
FeatureValueImpactPlot[modelfname,…]
指定された特徴 fname のインパクトだけをプロットする.
FeatureValueImpactPlot[modelfnameclass,…]
分類 class に対するインパクトだけをプロットする.
詳細とオプション
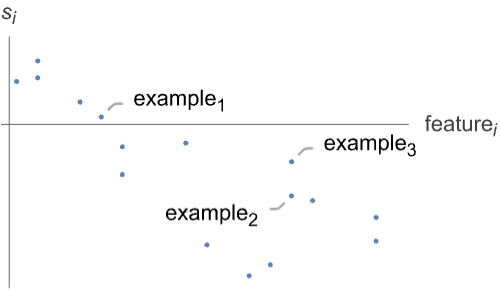
- FeatureImpactPlotは,例の特徴値が予測器や分類器等の機械学習モデルの結果にどのように貢献したのかを解釈するために使われる.
- 特徴のインパクトは,通常,さもなければ「ブラックボックス」になってしまう機械学習アルゴリズムの決定過程に対する洞察を与え,モデルの内部動作を理解し,望まないバイアス等を阻止するために使われる.
- すべての例について,インパクト
 は
は  の関数としてプロットされる.値
  のインパクトは
  による平均値
  からの偏差である.
 -
- 次は,model の可能な値である.
-
ClassifierFunction[…] 分類モデル PredictorFunction[…] 回帰モデル - 予測器の結果はスカラー値で siは平均予測
 からの偏差である.
 - 分類器の結果は通常は各クラスについての確率として返される対数オッズのベクトルである.
- インパクトt siは指定されたクラスについての対数オッズ事前確率 logodds0からの偏差である.
- 次は,data の可能な値である.
-
example 単一の例 {example1,…} 例のList,Associationまたは Dataset Automatic モデルの欠落した代入法を使って合成例を生成する - data が与えられていない場合は,訓練データに基づいてモデルの欠落した値合成器を使って合成例が生成される.
- 次は,fname の可能な値である.
-
All すべての特徴のインパクト(デフォルト) feature feature のインパクトのみ {feature1,…} featureiのリストのインパクト - 次は,model がClassifierFunction[…]のときの class の可能な値である.
-
All すべてのクラスについてのインパクト(デフォルト) name name というクラスについてのインパクトのみ {name1,…} nameiのリストについてのインパクト - FeatureImpactPlotにはGraphicsと同じオプションに以下の追加・変更を加えたものが使える. [全オプションのリスト]
-
AspectRatio 1/GoldenRatio 縦横比 Axes True 軸を描くかどうか AxesLabel Automatic 軸ラベル DataRange Automatic データに仮定する x の値の範囲 IntervalMarkers Automatic 不確かさをどのように描画するか IntervalMarkersStyle Automatic 不確かな要素のスタイル Filling None 各点の幹をどのように塗り潰すか FillingStyle Automatic 塗潰しのスタイル Joined False 点を繋ぐかどうか LabelingFunction Automatic 点のラベルの付けから LabelingSize Automatic コールアウトとラベルの最大サイズ MultiaxisArrangement None データの複数の軸をどのように配置するか PerformanceGoal $PerformanceGoal 最適化するパフォーマンスの局面 PlotLabel Automatic プロットの全体的なラベル PlotLabels Automatic データのラベル PlotLayout "Overlaid" データをどのように配置するか PlotLegends None データの凡例 PlotMarkers None 各点を示すためのマーカー PlotRange Automatic 含める値の範囲 PlotRangeClipping True プロット範囲で切り取るかどうか PlotStyle Automatic 点のスタイルを決定するグラフィックス指示子 PlotTheme $PlotTheme プロットの全体的なテーマ ScalingFunctions Automatic 個々の座標をどのようにスケールするか TargetUnits Automatic プロット内に表示する単位 - ColorData["DefaultPlotColors"]は,PlotStyleで使われるデフォルトの色のシーケンスを与える.
全オプションのリスト
例題
すべて開く すべて閉じる例 (2)
trainingset = Table[x -> 2x - 1, {x, 10}]predictor = Predict[trainingset, Method -> "LinearRegression"]モデルの結果の平均に対する入力の特徴のインパクトを可視化する:
FeatureValueImpactPlot[predictor, Range[10]]predictor[Range[10]] - Information[predictor, "TrainingLabelMean"]植物のいくつかの特徴から「アヤメ」の種を識別するように分類器を訓練する:
data = ResourceData["Sample Data: Fisher's Irises"];
First[data]model = Classify[data -> "Species", Method -> "LogisticRegression"]特徴の値が各クラスの確率にどのように影響するかを可視化する:
FeatureValueImpactPlot[model -> "PetalLength", data]スコープ (4)
model = Predict[{{1.3, "P"} -> 1, {1.8, "Q"} -> 2.5, {1.9, "Q"} -> 3, {0.2, "P"} -> 1, {-3.2, "P"} -> -4.2, {0.3, "Q"} -> 2}]FeatureValueImpactPlot[model, {{1.3, "P"}, {1.8, "Q"}, {1.9, "Q"}, {0.2, "P"}, {-3.2, "P"}, {0.3, "Q"}}]model = Classify[{{1.5, Blue} -> "A", {3.2, Blue} -> "A", {4.1, Red} -> "B", {5.3, Red} -> "B", {10., Green} -> "C", {12.4, Red} -> "C"}]FeatureValueImpactPlot[model, {{1.5, Blue}, {3.2, Blue}, {4.1, Red}, {5.3, Red}, {10., Green}, {12.4, Red}}]model = Predict[{{1.3, "P"} -> 1, {1.8, "Q"} -> 2.5, {1.9, "Q"} -> 3, {0.2, "P"} -> 1, {-3.2, "P"} -> -4.2, {0.3, "Q"} -> 2}]FeatureValueImpactPlot[model, {{1.3, "P"}, {1.8, "Q"}, {1.9, "Q"}, {0.2, "P"}, {-3.2, "P"}, {0.3, "Q"}}]model = Classify[{{1.5, Blue} -> "A", {3.2, Blue} -> "A", {4.1, Red} -> "B", {5.3, Red} -> "B", {10., Green} -> "C", {12.4, Red} -> "C"}]FeatureValueImpactPlot[model -> All -> "A", {{1.5, Blue}, {3.2, Blue}, {4.1, Red}, {5.3, Red}, {10., Green}, {12.4, Red}}]FeatureValueImpactPlot[model -> All -> {"A", "C"}, {{1.5, Blue}, {3.2, Blue}, {4.1, Red}, {5.3, Red}, {10., Green}, {12.4, Red}}]オプション (12)
AspectRatio (1)
AxesLabel (1)
AxesStyle (1)
Frame (2)
FrameLabel (2)
FeatureValueImpactPlot[Predict[Table[x -> 2 - x, {x, 10}]], Frame -> True, FrameLabel -> {"x"}]FeatureValueImpactPlot[Predict[Table[x -> 2 - x, {x, 10}]], Frame -> True, FrameLabel -> {{"left", "right"}, {"bottom", "top"}}]Filling (1)
MaxPlotPoints (1)
PlotLabel (1)
PlotLegends (1)
data = {{1.5, Blue} -> "A", {3.2, Blue} -> "A", {4.1, Red} -> "B", {5.3, Red} -> "B", {10., Green} -> "C", {12.4, Red} -> "C"};classifier = Classify[data]FeatureValueImpactPlot[classifier, Keys@data]FeatureValueImpactPlot[classifier, Keys@data, PlotLegends -> None]FeatureValueImpactPlot[classifier, Keys@data, PlotLegends -> "Placeholder"]FeatureValueImpactPlot[classifier, Keys@data, PlotLegends -> {"Class: A", "Class: B", "Class: C"}]PlotStyle (1)
アプリケーション (1)
特徴のバリエーションがさまざまなモデルに与える影響を分析する:
trainingset = Flatten@Table[{x, y} -> x * y - 5y, {x, 10}, {y, 10}];
Short[trainingset]
2つの特徴の非線形結合によって与えられる値を予測するように線形モデルを訓練する:
predictor = Predict[trainingset, Method -> "LinearRegression"]期待されるように,各特徴のインパクトはその特徴の値のみに依存する:
FeatureValueImpactPlot[predictor, trainingset[[All, 1]], PlotStyle -> PointSize@Medium]predictor2 = Predict[trainingset, Method -> "GradientBoostedTrees"]これで,例の中の他の特徴によって同じ特徴値が異なるインパクトを持てるようになった:
FeatureValueImpactPlot[predictor2, trainingset[[All, 1]], PlotStyle -> PointSize@Medium]テキスト
Wolfram Research (2022), FeatureValueImpactPlot, Wolfram言語関数, https://reference.wolfram.com/language/ref/FeatureValueImpactPlot.html.
CMS
Wolfram Language. 2022. "FeatureValueImpactPlot." Wolfram Language & System Documentation Center. Wolfram Research. https://reference.wolfram.com/language/ref/FeatureValueImpactPlot.html.
APA
Wolfram Language. (2022). FeatureValueImpactPlot. Wolfram Language & System Documentation Center. Retrieved from https://reference.wolfram.com/language/ref/FeatureValueImpactPlot.html